Stopping performance regressions before they ship
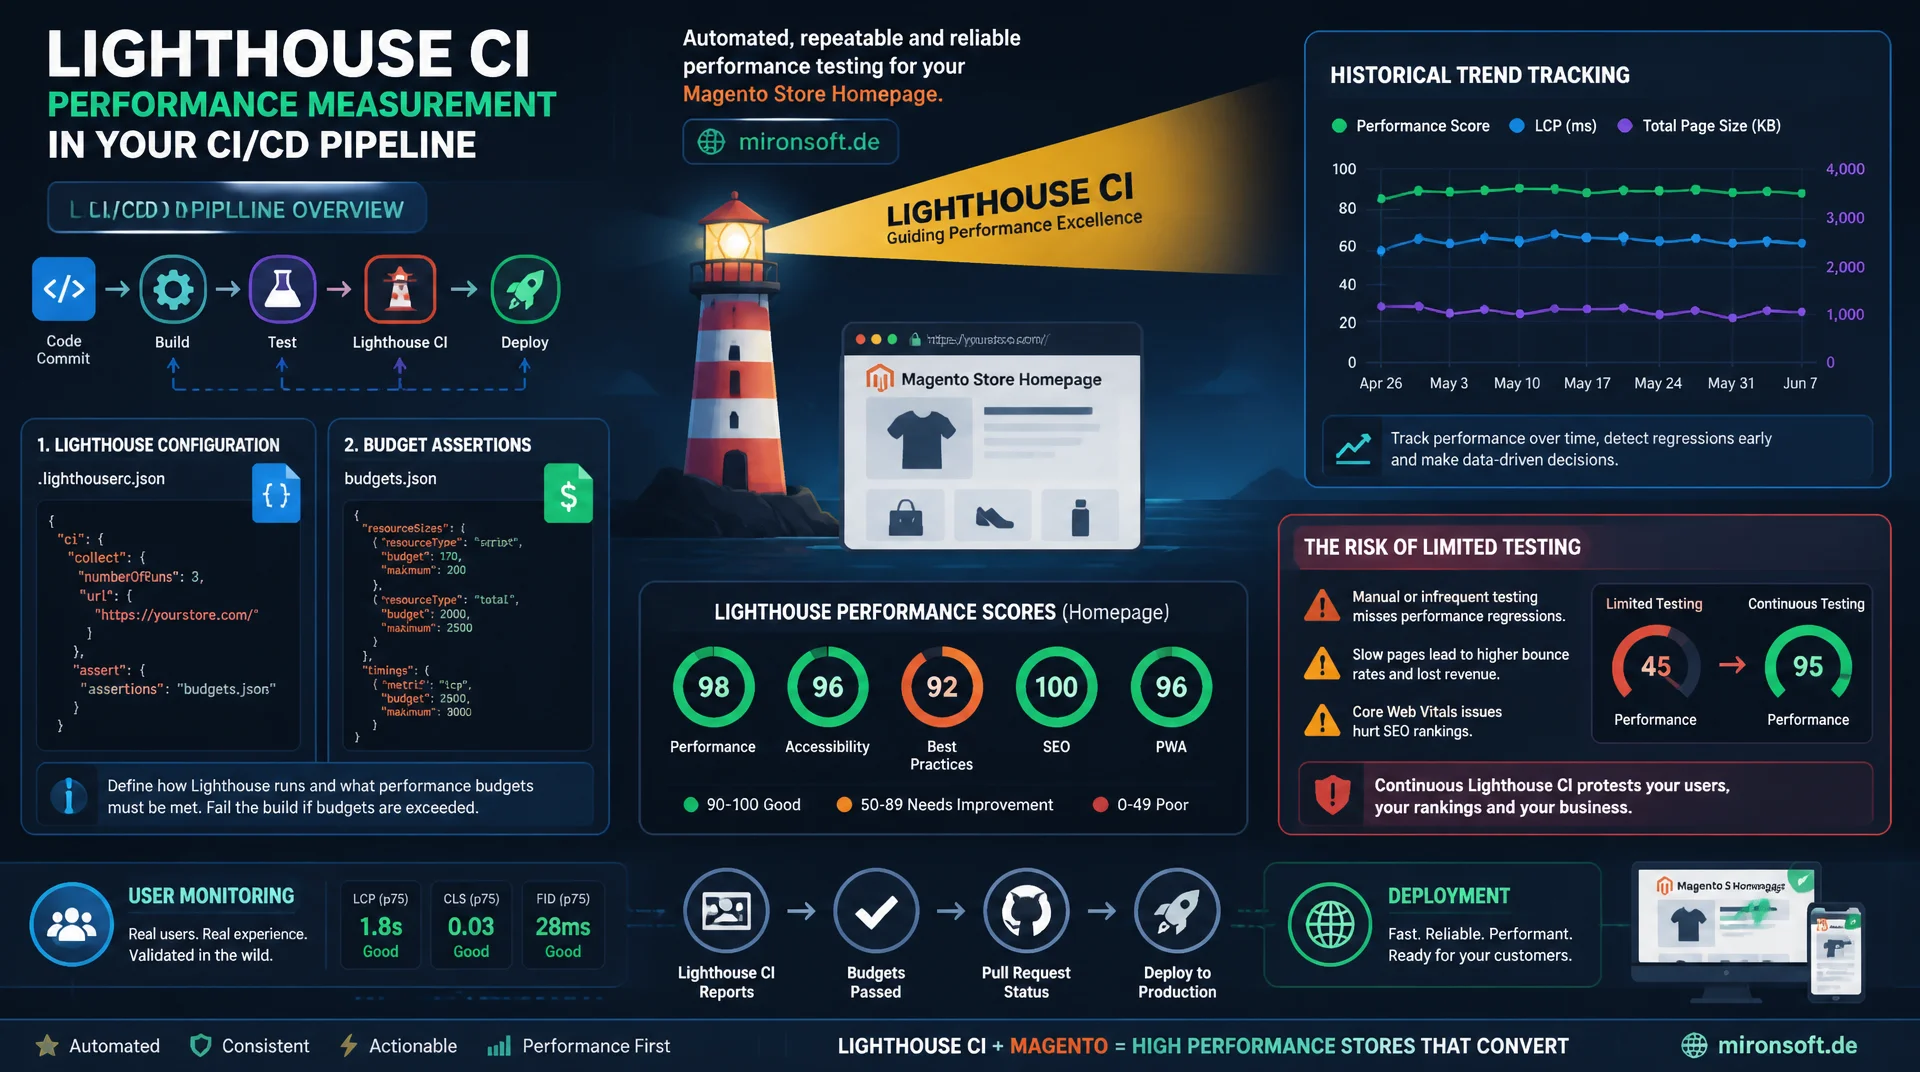
Lighthouse CI measures performance in a controlled, repeatable way directly inside the pipeline, preventing slow deployments from ever going live. This article explains the difference from Real User Monitoring, walks through a complete lighthouserc configuration with budget assertions, covers historical trend tracking, and shows why testing only the homepage creates a dangerous false sense of security for Magento stores.
Table of Contents
- 1. Synthetic Monitoring vs Real User Monitoring: two roles, not a contradiction
- 2. Installing and configuring Lighthouse CI in the pipeline
- 3. Budget assertions: making builds fail on purpose
- 4. CI integration: GitHub Actions and GitLab CI in detail
- 5. Historical trends: LHCI server vs filesystem storage
- 6. Testing multiple page types instead of just the homepage
- 7. Common Magento pitfalls in synthetic testing
- 8. RUM as a complement: web-vitals in real traffic
- 9. Synthetic vs RUM compared side by side
- 10. Summary
- 11. FAQ
1. Synthetic Monitoring vs Real User Monitoring: two roles, not a contradiction
Synthetic Monitoring runs controlled, repeatable measurements under simulated conditions, with a fixed network throttling profile and a defined CPU slowdown factor. That control is exactly what makes it the right tool for the CI/CD pipeline: two measurements of the same code produce comparable numbers, because variables like device type, network quality, or time of day are eliminated. Real User Monitoring (RUM), by contrast, captures measurements from real sessions of real visitors on real devices and networks, indispensable for knowing what users actually experience, but unsuitable for evaluating a single pull request.
The practical difference shows up in when you learn about a problem: synthetic monitoring in the pipeline catches a regression before it deploys. RUM only catches a regression after real users have already suffered through it, but with the full breadth of real-world devices and network conditions. Relying on only one of the two leaves a gap: RUM alone means every regression only becomes visible after the fact. Synthetic monitoring alone means the lab data never gets validated against the reality of your own customer base. Lighthouse CI closes exactly the first gap by turning performance measurement into a fixed, automated part of every deployment.
2. Installing and configuring Lighthouse CI in the pipeline
Lighthouse CI (LHCI) is Google's official tooling for running Lighthouse audits in an automated, repeatable way. Installation happens via @lhci/cli as a dev dependency, and configuration lives in a lighthouserc.js or lighthouserc.json file at the project root. That file defines three key blocks: collect for the URLs to test and the measurement parameters, assert for the thresholds each metric is checked against, and upload for where the results get sent.
The number of runs per URL is critical for reliable results: a single run is subject to measurement noise from system load on the CI runner, which is why numberOfRuns: 3 is considered the minimum, with LHCI automatically taking the median. For Magento stores with server-side rendering, it's also worth using a CPU throttling profile that reflects your actual customer devices, rather than Lighthouse's default settings, which are often too generous for a desktop runner.
// lighthouserc.js: base configuration for Lighthouse CI
module.exports = {
  ci: {
    collect: {
      // Number of runs per URL, LHCI automatically takes the median
      numberOfRuns: 3,
      settings: {
        preset: 'desktop',
        // Match CPU throttling realistically to target hardware
        throttlingMethod: 'simulate',
        throttling: {
          cpuSlowdownMultiplier: 4,
        },
      },
      // Base URL gets overridden per environment (staging/preview)
      startServerCommand: 'php -S 0.0.0.0:8080 -t pub',
      startServerReadyPattern: 'Listening',
    },
    assert: {
      preset: 'lighthouse:recommended',
    },
    upload: {
      target: 'filesystem',
      outputDir: './lhci-reports',
    },
  },
};
3. Budget assertions: making builds fail on purpose
The real value of Lighthouse CI only appears once you add budget assertions: fixed thresholds that, when exceeded, make the build fail with a non-zero exit code and block the merge. Without assertions, LHCI is just a reporting tool producing numbers nobody consistently checks. With assertions, performance becomes a property that gets enforced just as strictly as a failing unit test.
Assertions can be configured per metric at three levels: off disables the check, warn prints a warning without stopping the build, and error fails the build. For critical metrics like largest-contentful-paint or total-blocking-time, error with a numeric maxNumericValue is the right choice, while less critical audits like uses-text-compression can be introduced with warn first, so teams aren't immediately overwhelmed with a wall of red builds. A separate budget.json in the standard performance budget format complements the LHCI assertions with resource budgets per category, such as script or image size.
{
  "ci": {
    "assert": {
      "assertions": {
        "categories:performance": ["error", { "minScore": 0.85 }],
        "largest-contentful-paint": ["error", { "maxNumericValue": 2500 }],
        "total-blocking-time": ["error", { "maxNumericValue": 300 }],
        "cumulative-layout-shift": ["error", { "maxNumericValue": 0.1 }],
        "interactive": ["warn", { "maxNumericValue": 4000 }],
        "uses-text-compression": ["warn", {}],
        "uses-responsive-images": ["warn", {}]
      }
    }
  }
}
4. CI integration: GitHub Actions and GitLab CI in detail
Integrating with GitHub Actions runs through a dedicated job that picks up after the build step: the application gets built and started locally first, then lhci autorun runs the configured URLs and evaluates the assertions. It's important to only start this job after a successful static content deploy, since unbundled CSS or JavaScript artificially skews the measurements and triggers false alarms. For preview environments, it's best to test the actual staging URL rather than a local server, so CDN and cache behavior get captured realistically too.
In GitLab CI, the same principle runs through a dedicated stage in .gitlab-ci.yml, usually after deploying to a review app. Both systems support uploading the HTML reports as an artifact, so developers can open the visual Lighthouse report directly on a failed build instead of just seeing a red status line. A token for the LHCI server, or an access token for filesystem storage in a shared cache directory, should be stored as a CI secret in both cases, never checked into the repository.
# .github/workflows/lighthouse-ci.yml
name: Lighthouse CI

on:
  pull_request:
    branches: [main]

jobs:
  lighthouse:
    runs-on: ubuntu-latest
    steps:
      - uses: actions/checkout@v4

      - uses: actions/setup-node@v4
        with:
          node-version: 20

      - name: Install dependencies
        run: npm ci

      - name: Build static assets
        run: npm run build

      - name: Run Lighthouse CI against multiple page types
        run: npx lhci autorun --config=./lighthouserc.js
        env:
          LHCI_GITHUB_APP_TOKEN: ${{ secrets.LHCI_GITHUB_APP_TOKEN }}

      - name: Upload Lighthouse reports
        if: always()
        uses: actions/upload-artifact@v4
        with:
          name: lighthouse-reports
          path: ./lhci-reports
5. Historical trends: LHCI server vs filesystem storage
A single build report only answers "Is this pull request good enough?", not the more important question "Is our performance slowly degrading over weeks?" That's what historical trend tracking is for. LHCI offers two storage options: the self-hosted LHCI server stores every run in a SQL database, provides a web UI with time-series charts per metric and URL, and can automatically compare against the last green build on the target branch. That's the right approach for teams who actively want to keep an eye on performance trends.
The lightweight alternative is filesystem storage: reports get written as JSON files into an artifact directory and persisted through the CI pipeline, for example into an S3 bucket or as a CI artifact with a long retention period. Without running a server, a simple script can extract a trend across the last N builds and post it as a comment on the pull request. For smaller teams without dedicated infrastructure, this is often the more pragmatic starting point before running an LHCI server becomes worthwhile.
#!/usr/bin/env bash
# Run Lighthouse CI against multiple page types and archive the reports
set -euo pipefail

BASE_URL="https://staging.mironsoft-shop.example"
TIMESTAMP=$(date +%Y%m%d-%H%M%S)
REPORT_DIR="./lhci-reports/${TIMESTAMP}"

mkdir -p "${REPORT_DIR}"

npx lhci collect \
  --url="${BASE_URL}/" \
  --url="${BASE_URL}/women/dresses.html" \
  --url="${BASE_URL}/women/summer-dress-red.html" \
  --url="${BASE_URL}/checkout/" \
  --numberOfRuns=3

npx lhci assert --config=./lighthouserc.js

# Archive reports for historical comparison
cp -r .lighthouseci/*.json "${REPORT_DIR}/"
echo "Reports saved to ${REPORT_DIR}"
6. Testing multiple page types instead of just the homepage
The homepage of a Magento store is almost always the most heavily optimized page: it has a handful of carefully chosen images, no complex forms, and often an aggressively configured Full Page Cache. Category pages with layered navigation, product listings, and pagination, product pages with galleries, variant selectors, and cross-sell widgets, and the checkout with its many interactive form fields all have a completely different performance profile. A Lighthouse CI setup that only tests the homepage is therefore systematically measuring the least representative page in the entire store.
The url list in the collect block should cover at least four page types: the homepage, a category page with a realistic product count, a product page with a gallery and reviews, and the first checkout step. Edge cases like a faceted filter with many active filters, or a search results page with zero hits, are worth an extra entry too, since these states often load additional JavaScript logic and DOM elements. Important: for logged-in or personalized states like a checkout with items already in the cart, LHCI needs a puppeteerScript that sets cookies or fills out a login form before measurement, since Lighthouse measures as an anonymous visitor by default.
7. Common Magento pitfalls in synthetic testing
A frequent mistake with Magento stores is running Lighthouse CI against a local Docker environment with the Full Page Cache disabled, since developers typically turn the cache off for local debugging. The measured values then come out far worse than production, and assertions either trigger far too early or get set so generously they become useless in production. The target environment for Lighthouse CI should therefore always be a staging or review app with a production-like configuration, including an enabled Varnish or built-in Full Page Cache and deployed static content assets.
A second pitfall involves dynamic content: stock levels, prices, and promotional banners change between measurement runs, producing what looks like random measurement noise but is actually a content change. Fixed test fixtures with stable product SKUs and disabled time-based campaigns on the staging environment eliminate this source of error. Equally important: third-party scripts like chat widgets or A/B testing tools should either load identically to production in staging or be deliberately blocked, but never differ uncontrolled between production and staging, otherwise Lighthouse CI ends up measuring something different from what customers actually experience.
8. RUM as a complement: web-vitals in real traffic
Lighthouse CI alone doesn't capture what actually happens for real users on slow mobile networks, older devices, or with browser extensions enabled. This is exactly where Real User Monitoring with the web-vitals JavaScript library complements the synthetic pipeline checks: every real session sends its LCP, INP, and CLS values to an analytics backend, making it possible to see the actual distribution across the full customer spectrum, not just a single simulated run.
In practice, the two systems complement each other in a clear workflow: Lighthouse CI prevents a pull request with an obvious regression from ever getting merged. RUM continuously monitors whether the sum of many unremarkable changes adds up to a slow degradation over weeks, something no single build check would ever catch. When a RUM alert triggers, you can then run a targeted Lighthouse CI check against the affected page and the suspected commit range to synthetically reproduce and verify the regression before merging the fix.
| Aspect | Homepage-only testing | Multi-page testing |
|---|---|---|
| Representativeness | Measures the most optimized page | Covers home, category, product, checkout |
| Checkout regressions | Go completely undetected | Caught before merge |
| Cache behavior | Only measures static FPC hits | Covers static and dynamic pages |
| JS bundle load | Gallery and variant JS goes unnoticed | Product page JS gets checked directly |
| Effort per build | Low, but misleading | Higher, but a reliable signal |
Mironsoft
Performance monitoring, CI/CD pipelines, and Hyvä optimization for Magento stores
Ready to stop performance regressions automatically?
We set up Lighthouse CI for your Magento store, define reliable budget assertions across every relevant page type, and connect synthetic checks with Real User Monitoring for a complete performance picture.
Lighthouse CI setup
lighthouserc configuration, budgets, and multi-page testing for GitHub Actions or GitLab CI
Budget assertions
Realistic thresholds that stop builds on purpose instead of producing noise
RUM integration
web-vitals tracking and trend history as a complement to synthetic pipeline checks
10. Summary
Synthetic Monitoring with Lighthouse CI addresses one core problem: performance regressions get caught before they deploy, not after customers have already suffered through them. A reliable lighthouserc.js with multiple runs per URL, clearly defined budget assertions using error and warn thresholds, and integration into GitHub Actions or GitLab CI turns performance into a property that gets enforced just as strictly as a failing test. Historical trend tracking through an LHCI server or simple filesystem storage makes slow degradations visible that a single build check would never catch.
The decisive lever for Magento stores lies in test scope: testing only the homepage measures the least representative page in the entire store and systematically misses regressions on category, product, and checkout pages. Combined with Real User Monitoring via the web-vitals library, this produces a complete picture: synthetic monitoring as preventive control in the pipeline, RUM as continuous observation of actual user experience in the field.
Synthetic Monitoring with Lighthouse CI - The Essentials at a Glance
Synthetic vs RUM
Synthetic monitoring checks before deploy, RUM observes real users afterward. Both roles complement each other, they don't replace one another.
Budget assertions
error stops the build, warn only informs. Always configure critical metrics like LCP and TBT as error.
Historical trends
LHCI server for time-series charts and regression comparison, filesystem storage as a lightweight alternative.
Multi-page testing
Include at least home, category, product, and checkout in the collect URL list, not just the homepage.