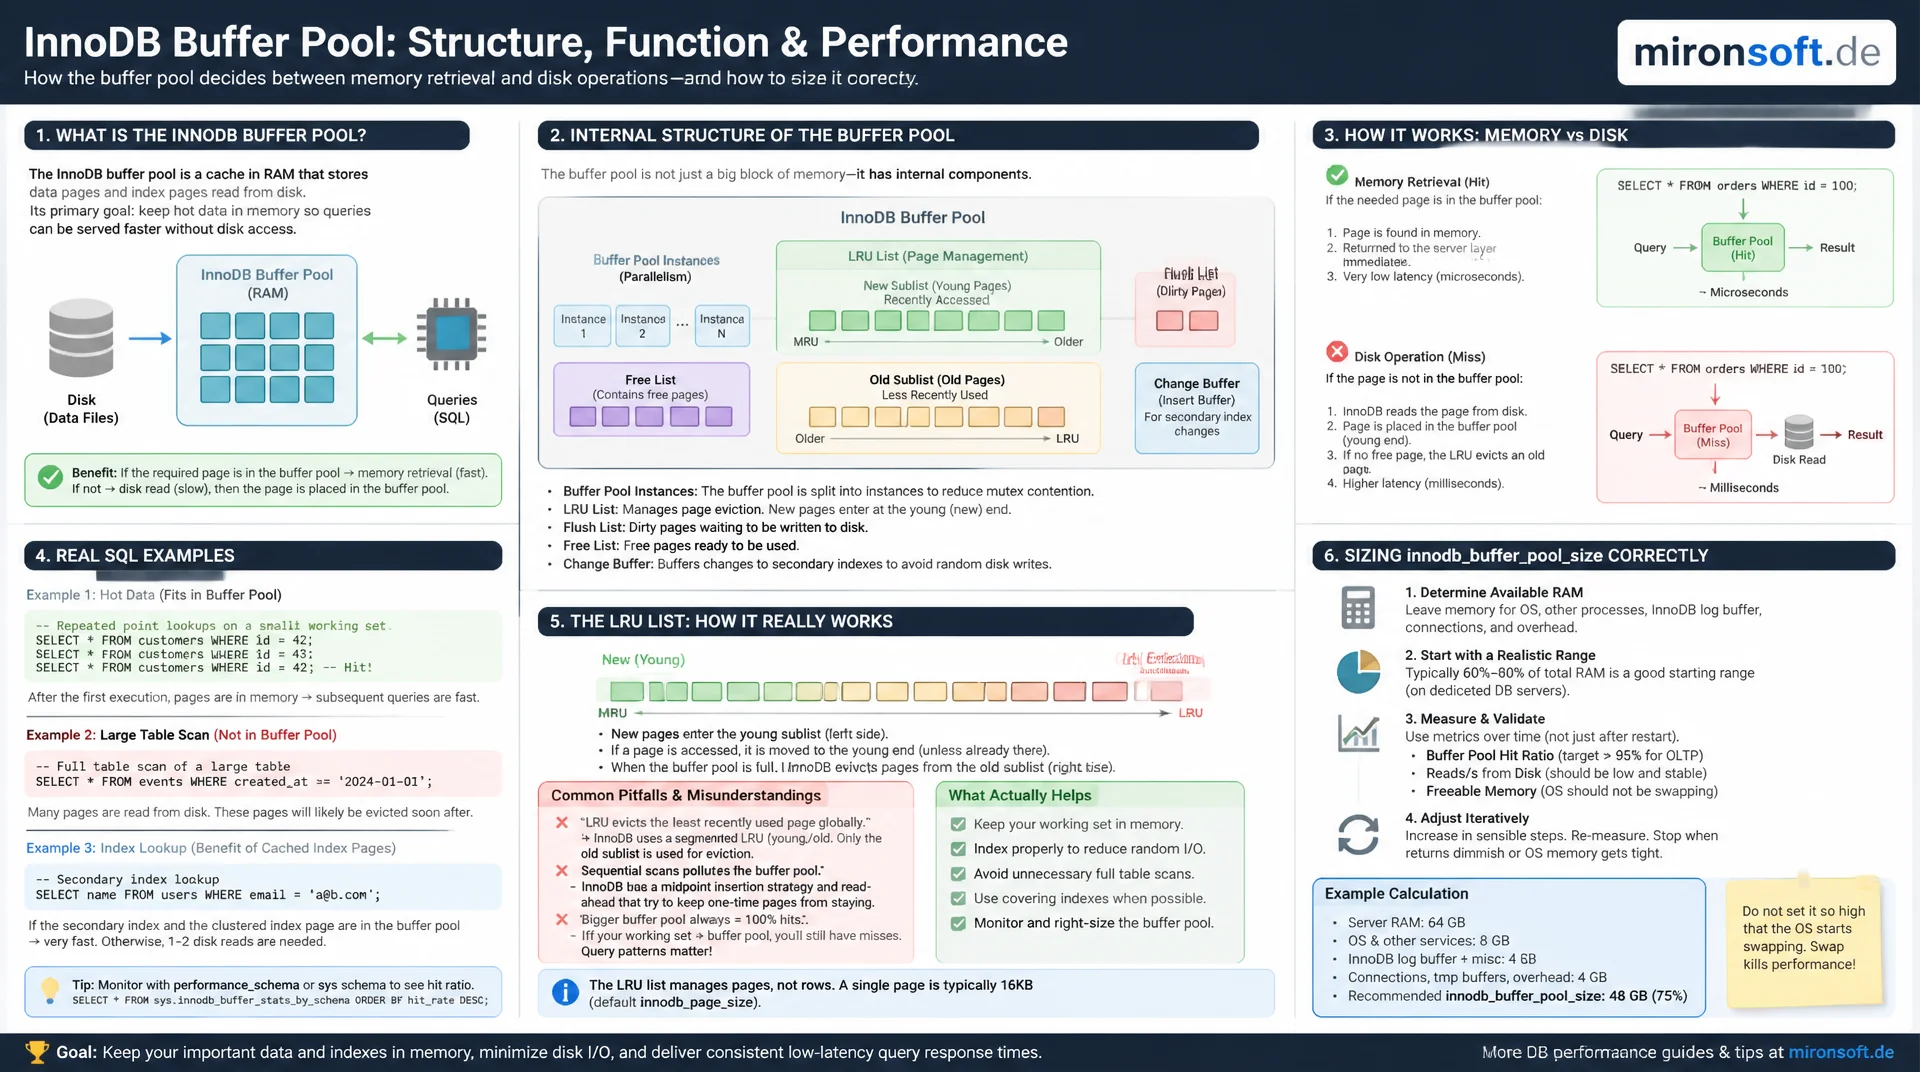
Understanding Architecture and Sizing
The InnoDB buffer pool decides whether a query is answered from memory in microseconds or triggers a slow disk operation. Anyone who sizes innodb_buffer_pool_size incorrectly or misunderstands the LRU list gives up performance that no index tuning can recover. This article explains the buffer pool's structure, sizing methodology and monitoring with real SQL examples.
Table of Contents
- 1. What the buffer pool actually does
- 2. Structure: pages, frames and buffer pool instances
- 3. The LRU list: young and old sublist in detail
- 4. Sizing innodb_buffer_pool_size correctly
- 5. Buffer pool instances: when multiple make sense
- 6. Warm-up after restart: dump and load
- 7. Monitoring: hit ratio and performance schema
- 8. Common misconfigurations and their symptoms
- 9. Sizing strategies compared
- 10. Summary
- 11. FAQ
1. What the buffer pool actually does
The InnoDB buffer pool is the central cache area in memory where InnoDB keeps table and index data in the form of pages. Every read, every write, and every row change first passes through the buffer pool before anything is written to disk. Without this cache every query would have to work directly against the storage device, which is orders of magnitude slower than a RAM access, even with rotating disks and even with NVMe SSDs. The buffer pool is therefore not a peripheral optimization but the basic precondition for a relational database to perform well at all.
In practice the effect shows up immediately: a query whose required pages already sit in the buffer pool is typically answered in under a millisecond. If InnoDB first has to load the same page from disk, several milliseconds can pass, and considerably more on heavily loaded systems with many concurrent I/O operations. In a typical OLTP workload with thousands of queries per second, the buffer pool hit rate directly decides whether a server handles the load or runs into an I/O queue. The following sections explain how the buffer pool is organized internally and how to size it correctly for your own workload.
2. Structure: pages, frames and buffer pool instances
The buffer pool consists of a fixed number of frames, each holding exactly one page. The page size is set via innodb_page_size and defaults to 16 KB. When a page is needed that is not yet in memory, InnoDB loads it into a free or evicted frame. Internally InnoDB manages several structures at once: a hash table for fast access to already loaded pages, the flush list for modified pages not yet written to disk, and the LRU list, which decides which page gets evicted first under memory pressure.
So the buffer pool does not become a bottleneck under many concurrent threads, InnoDB splits it into several instances, controlled via innodb_buffer_pool_instances. Each instance manages its own structures and its own mutex, so accesses from different threads collide less often. The total buffer pool size is split evenly across the instances, and each instance should be at least 1 GB, otherwise MySQL automatically reduces the number of instances. The following command shows the current configuration and memory usage:
-- Current buffer pool configuration and memory usage
SHOW VARIABLES LIKE 'innodb_buffer_pool%';

-- Result excerpt:
-- innodb_buffer_pool_size        | 8589934592  (8 GB)
-- innodb_buffer_pool_instances   | 8
-- innodb_buffer_pool_chunk_size  | 134217728   (128 MB)

-- Per-instance statistics
SELECT
    POOL_ID,
    POOL_SIZE,
    FREE_BUFFERS,
    DATABASE_PAGES,
    OLD_DATABASE_PAGES
FROM information_schema.INNODB_BUFFER_POOL_STATS;
3. The LRU list: young and old sublist in detail
The LRU list in the buffer pool does not work like a classic least-recently-used algorithm, because a naive LRU approach would fail catastrophically on large scans. A single SELECT without a WHERE clause over a large table would otherwise flood the entire buffer pool with pages that are only read once, evicting the actually frequently used data in the process. InnoDB solves this by splitting the LRU list into two regions: the young sublist at the head of the list for frequently used pages, and the old sublist for recently loaded, not yet proven pages.
Newly loaded pages always land in the old sublist first, whose size defaults to 37 percent of the list, controlled via innodb_old_blocks_pct. Only when a page inside the old sublist is requested again after at least innodb_old_blocks_time milliseconds does it move to the young sublist. This time filter prevents a single sequential scan from polluting the young sublist, since a page read twice in quick succession during a scan does not count as genuinely frequently used. For analytics workloads with many large scans it pays off to set innodb_old_blocks_time to a higher value like 1000, protecting hot data from eviction even more consistently.
-- Inspect LRU configuration relevant to scan resistance
SHOW VARIABLES LIKE 'innodb_old_blocks%';

-- innodb_old_blocks_pct  | 37
-- innodb_old_blocks_time | 1000

-- Adjust for analytics-heavy workloads with frequent large scans
SET GLOBAL innodb_old_blocks_time = 1000;

-- Check how many pages currently sit in the old sublist
SELECT
    POOL_ID,
    DATABASE_PAGES,
    OLD_DATABASE_PAGES,
    ROUND(OLD_DATABASE_PAGES / DATABASE_PAGES * 100, 2) AS old_pct
FROM information_schema.INNODB_BUFFER_POOL_STATS;
4. Sizing innodb_buffer_pool_size correctly
The rule of thumb for innodb_buffer_pool_size is: as large as possible without pushing the operating system into swap. On a dedicated database server, 60 to 75 percent of available RAM is often reserved for the buffer pool, with the rest left for the operating system, connection threads, sort buffers and other InnoDB structures such as the log buffer. This rule of thumb is a starting point, not an exact formula, because the actual need depends on the size of the working set, meaning the amount of data actively read and written.
A more precise method is to determine the size of the actually used InnoDB data and size the buffer pool so this working set fits entirely inside it. If the total data volume is much larger than available RAM, for example in a data warehouse with several terabytes, it is worth analyzing actual access patterns instead, so only the hot tables stay in the buffer pool. On virtualized systems with limited RAM, as often found in smaller Magento installations, the realistic working set size is often smaller than assumed, because only a fraction of the catalog is actually queried frequently.
# /etc/mysql/conf.d/innodb-buffer-pool.cnf
[mysqld]
# Rule of thumb: 60-75% of total RAM on a dedicated DB server
innodb_buffer_pool_size = 12G
innodb_buffer_pool_instances = 8
innodb_buffer_pool_chunk_size = 134217728

# Determine current InnoDB data + index size with SQL:
# SELECT ROUND(SUM(data_length + index_length) / 1024 / 1024 / 1024, 2) AS gb
# FROM information_schema.tables WHERE engine = 'InnoDB';
5. Buffer pool instances: when multiple make sense
Multiple buffer pool instances reduce contention on internal mutexes, but only bring a measurable benefit with a sufficiently large buffer pool. Below a total size of 1 GB, MySQL ignores the innodb_buffer_pool_instances setting anyway and works with a single instance, since splitting into several tiny instances would not make sense. Only from several gigabytes of total size and a high number of concurrent connections does the parallelization effect become noticeable, typically on systems with more than 16 CPU cores and correspondingly many parallel threads.
A common mistake is maximizing the number of instances independently of the buffer pool size. Since each instance must be at least 1 GB, an excessive instance count with moderate RAM causes MySQL to automatically reduce the configuration and write a warning to the error log. As a practical rule: below an 8 GB buffer pool, 4 instances are enough, above that 8 instances are a solid default that has proven itself in most production environments.
6. Warm-up after restart: dump and load
After a restart, the buffer pool is completely empty, and every query has to load its pages from disk first until the cache has filled up again with the relevant data. This warm-up phase can take minutes to hours on large databases, during which response times are noticeably higher than in steady state. InnoDB offers a built-in mechanism for this: before shutdown, innodb_buffer_pool_dump_at_shutdown writes a compact list of the pages currently loaded in the buffer pool to disk, not the pages themselves, just the information about which pages they were.
On the next start, InnoDB reads this list via innodb_buffer_pool_load_at_startup and proactively reloads the corresponding pages in parallel with normal operation. This lets the server reach a production-level buffer pool hit rate much faster, without waiting for organic warm-up through real traffic. Both options are enabled by default in modern MySQL versions but should be explicitly checked after every upgrade and in every custom configuration.
# /etc/mysql/conf.d/innodb-warmup.cnf
[mysqld]
innodb_buffer_pool_dump_at_shutdown = ON
innodb_buffer_pool_load_at_startup = ON
innodb_buffer_pool_dump_pct = 50
7. Monitoring: hit ratio and performance schema
The hit rate of the buffer pool, commonly called the hit ratio, is the most important metric for judging whether the current size is sufficient. A healthy production environment typically reaches a hit ratio of 99 percent or higher. If the value drops noticeably below that, for example after importing large amounts of data or as the data volume grows, that is a clear signal the buffer pool should be enlarged, or that an unusual query is currently flushing large amounts of data through the cache.
The calculation uses the global status variables Innodb_buffer_pool_read_requests for logical read requests and Innodb_buffer_pool_reads for actual physical disk accesses. In addition, the performance schema provides more detailed insight, for example which tables and indexes occupy the most memory in the buffer pool, which helps prioritize optimization work.
-- Calculate buffer pool hit ratio from global status
SELECT
    ROUND(
      (1 - (
        (SELECT VARIABLE_VALUE FROM performance_schema.global_status
         WHERE VARIABLE_NAME = 'Innodb_buffer_pool_reads') /
        (SELECT VARIABLE_VALUE FROM performance_schema.global_status
         WHERE VARIABLE_NAME = 'Innodb_buffer_pool_read_requests')
      )) * 100, 4
    ) AS hit_ratio_pct;

-- Which tables occupy the most buffer pool memory
SELECT
    object_schema,
    object_name,
    COUNT(*) AS pages,
    ROUND(COUNT(*) * 16384 / 1024 / 1024, 2) AS mb
FROM performance_schema.innodb_buffer_page
WHERE object_schema NOT IN ('mysql', 'information_schema')
GROUP BY object_schema, object_name
ORDER BY pages DESC
LIMIT 10;
8. Common misconfigurations and their symptoms
The most common mistake with the buffer pool is a size too small relative to the working set. The symptom usually shows up first in I/O utilization: the server produces consistently high physical read values, even though the application keeps querying the same data repeatedly. A second common mistake is an oversized buffer pool on a system with little RAM, causing the operating system to start swapping. Swapping is especially damaging for a database because it completely negates the intended acceleration from the cache and instead produces even slower access patterns than without a cache at all.
A third, subtler mistake concerns the instance count combined with many small tables: if innodb_buffer_pool_instances is set much higher than reasonable, the already scarce memory spreads too thin across too many instances, lowering the hit probability per instance. Anyone recognizing these symptoms should first check the hit ratio, then determine the actual working set size, and only afterward adjust the configuration step by step, instead of reflexively doubling the value.
9. Sizing strategies compared
There is no single correct size for the buffer pool, but different strategies depending on workload type and available memory. The following table compares common approaches and shows when each strategy makes sense.
| Scenario | Strategy | Typical size | Risk if misconfigured |
|---|---|---|---|
| Dedicated DB server | 60 to 75 percent of RAM | Several GB to TB | Swap when oversized |
| Shared server with app | 30 to 40 percent of RAM | 1 to 4 GB | Too small for working set |
| Data warehouse, TB scale | Working set based, not full dataset | 10 to 50 percent of dataset | Hit ratio permanently low |
| Small cloud instance | Conservative, with OS reserve | 512 MB to 2 GB | OOM killer with too tight a reserve |
Regardless of the scenario, the size of the buffer pool should be reassessed after every significant change in data volume. An online shop whose catalog grows from 10,000 to 100,000 products within a year will very likely need a larger buffer pool to maintain the same hit ratio.
Mironsoft
MySQL performance tuning and database consulting
Time to put your buffer pool and InnoDB config to the test?
We analyze your InnoDB configuration, determine the real working set size, and tune buffer pool, log files and other parameters to your actual workload.
Performance audit
Systematically analyze hit ratio, I/O patterns and working set
Sizing consulting
Data-driven sizing of buffer pool and other InnoDB parameters
Monitoring setup
Build dashboards for hit ratio and buffer pool utilization
10. Summary
The InnoDB buffer pool is the single most important configuration parameter for MySQL performance. It keeps table and index data in RAM, organizes access through a scan-resistant LRU list with young and old sublists, and can be parallelized across multiple instances to reduce contention under high load. The correct size for innodb_buffer_pool_size follows from the working set size of your own workload, not from a flat percentage alone.
Monitoring through the hit ratio and the performance schema shows early when the buffer pool reaches its limits. Combined with dump and load at restart, the hit rate stays stable even after maintenance windows, without the server having to go through a long warm-up phase every time. Anyone who understands these mechanisms can often improve MySQL performance more noticeably than through index or query tuning alone.
InnoDB buffer pool architecture and sizing, the essentials at a glance
Sizing rule of thumb
60 to 75 percent of RAM on dedicated servers, but always aligned with the real working set size.
LRU list
Young and old sublists protect the buffer pool from eviction by one-off sequential scans.
Monitoring
Calculate hit ratio from Innodb_buffer_pool_reads and read_requests, target 99 percent or higher.
Warm-up
innodb_buffer_pool_dump_at_shutdown and load_at_startup shorten the warm-up phase after restarts.