evidence instead of gut feeling
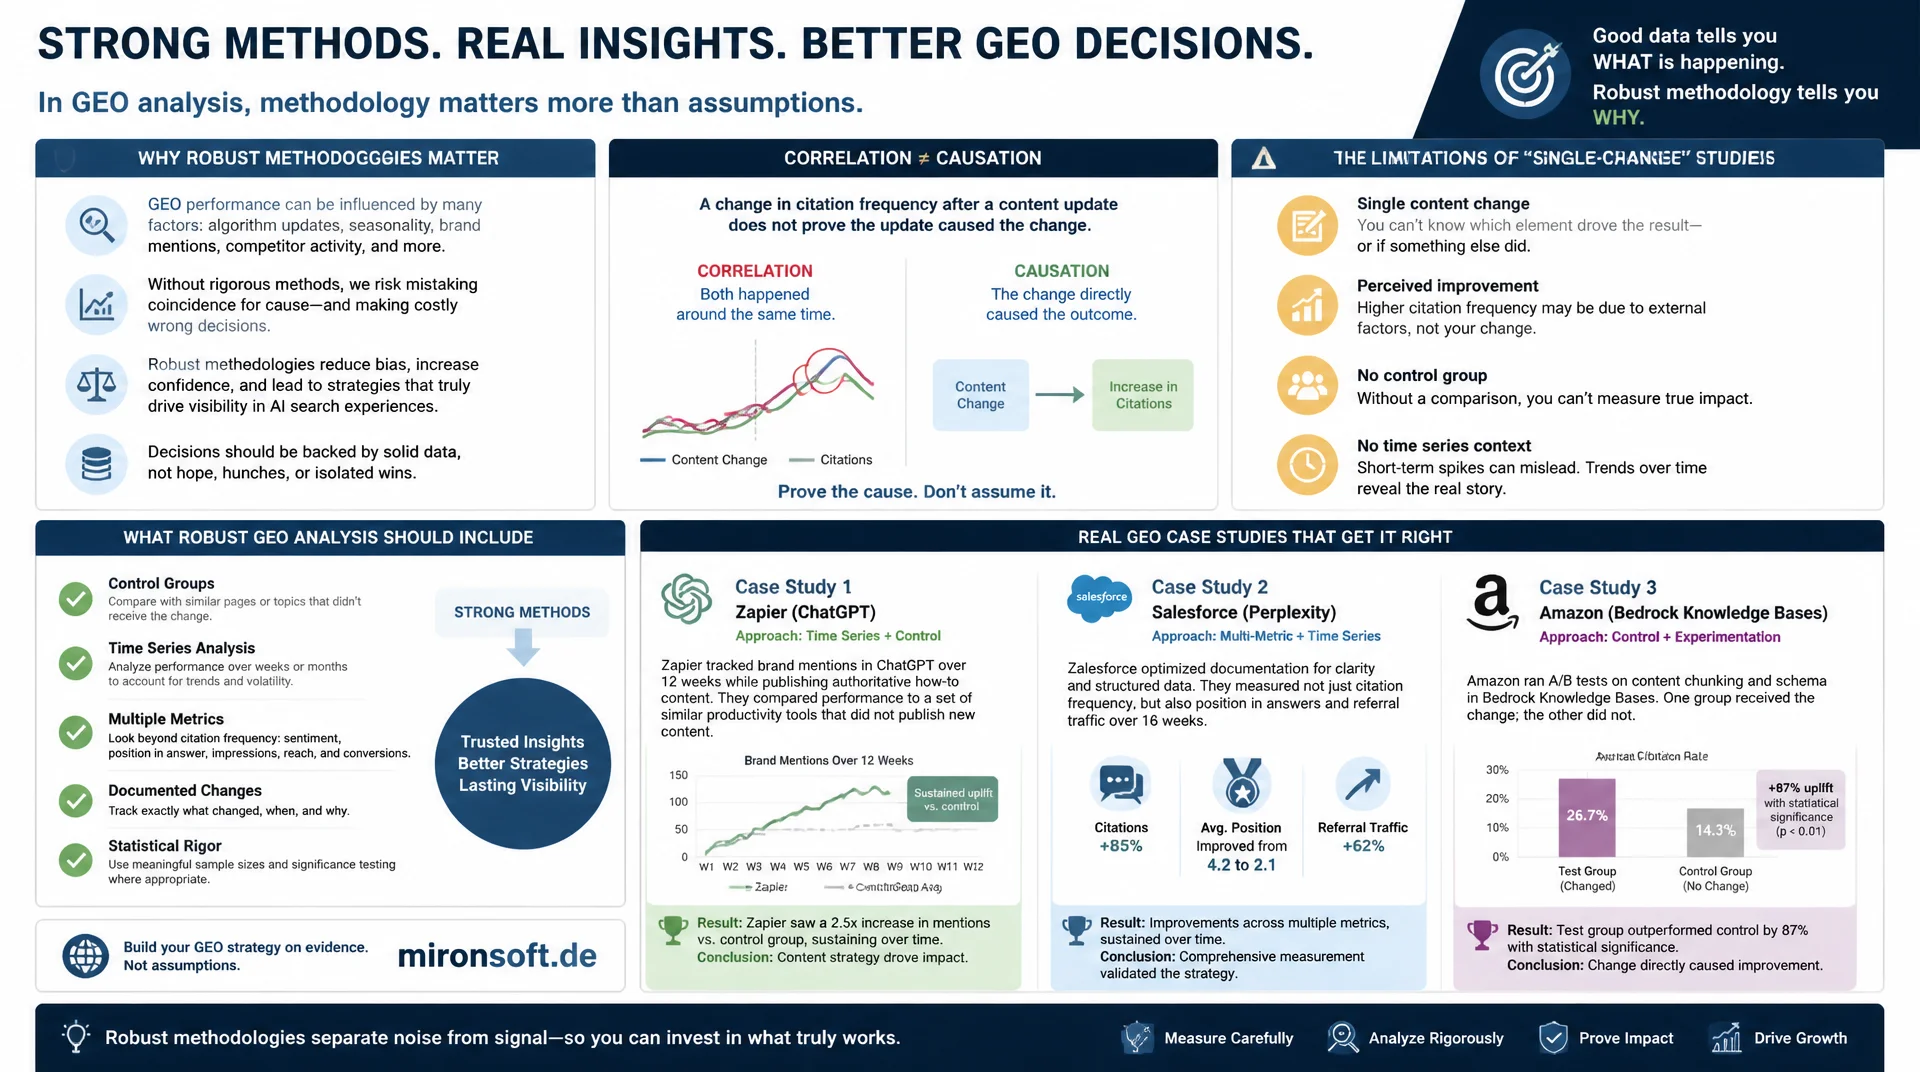
Many GEO claims online rest on a single content change, followed by a perceived improvement in citation frequency, with no control group or time series comparison at all. Real GEO case studies need a methodology that separates correlation from causation, so decisions rest on solid data instead of individual anecdotes.
Table of Contents
- 1. Why GEO Case Studies Should Be Read With Caution
- 2. The Core Problem: Correlation vs. Causation
- 3. Solid Methodology: Setting Up a Clean GEO Test
- 4. Patterns With Proven Effect: Structure and Extractability
- 5. Patterns With Unclear Effect: Volume and Meta Tag Hacks
- 6. Running an Internal GEO Test in Practice
- 7. Assessing Publication Bias and Marketing Claims
- 8. Time Horizons: Why GEO Effects Need Weeks to Months
- 9. A Scoring Grid for GEO Claims
- 10. Summary
- 11. FAQ
1. Why GEO Case Studies Should Be Read With Caution
Since GEO became a widely used term, numerous blog posts and conference talks have circulated with sensational claims: a specific measure supposedly tripled citation frequency, a single structured dataset supposedly brought instant visibility in ChatGPT answers. The vast majority of such GEO case studies are methodologically unreliable, because they lack the basic building blocks of a clean investigation: a comparison group, a before-and-after comparison over a sufficiently long period, and control for external influencing factors.
This does not mean GEO measures are ineffective. It means that most publicly circulating GEO case studies do not provide a reliable basis for your own decisions, because they selectively report what worked without mentioning the cases where the same measure showed no effect. This article does not describe invented individual cases but a methodology for distinguishing real GEO effect from chance and confirmation bias, and shows general patterns that tend to work across repeated, cleanly set up observations.
Anyone who wants to spend GEO budget sensibly needs a tool to check other people's claims and to run their own tests with methodological rigor. That is exactly the goal of the following sections.
2. The Core Problem: Correlation vs. Causation
The most common methodological weakness in GEO reports is confusing temporal sequence with cause and effect. A website changes its content structure, and two weeks later the observed citation frequency rises. That alone proves no causal relationship, because the underlying language model could have been updated in the same period, competitors may have changed their own visibility, or seasonal demand fluctuations may have influenced the measured prompt answers.
An additional problem is the small sample size of many circulating reports: a single domain, a single topic cluster, a few weeks of observation. Deriving a general rule from such a small sample, for example "FAQ schema increases citation frequency by X percent", systematically overestimates the significance of the underlying data. Solid statements about GEO effect require either a sufficiently large sample across many domains and topics, or a controlled test setup with a comparison group within the same domain.
{
  "misleading_single_observation": {
    "claim": "FAQ schema tripled citation frequency",
    "actual_conditions": {
      "sample_size": 1,
      "control_group": false,
      "observation_weeks": 2,
      "concurrent_events": [
        "model update by AI provider",
        "competitor page went offline"
      ]
    },
    "verdict": "confounded, not attributable to the change alone"
  }
}
3. Solid Methodology: Setting Up a Clean GEO Test
A methodologically sound investigation of GEO measures follows the same basic principle as a controlled experiment: a test group of pages receives the change under investigation, a comparable control group remains unchanged, and both groups are observed over the same period with the same prompt set. Only if the test group develops significantly differently from the control group can the observed change be attributed to the tested measure rather than to general trends in model behavior.
Choosing the control group is decisive here: pages with a similar topic area, a similar starting level of citation frequency, and similar content scope deliver the most meaningful comparison values. Comparing a test group of highly competitive topics against a control group of niche topics systematically distorts the result, because different starting conditions affect the measured metric independently of the actually tested measure.
{
  "geo_test_design": {
    "hypothesis": "Adding FAQPage schema increases citation frequency",
    "test_group": {
      "page_count": 24,
      "modification": "FAQPage schema added",
      "topic_cluster": "GEO fundamentals"
    },
    "control_group": {
      "page_count": 24,
      "modification": "none",
      "topic_cluster": "GEO fundamentals"
    },
    "measurement": {
      "prompt_set_size": 60,
      "baseline_period_weeks": 4,
      "post_change_period_weeks": 8,
      "metric": "citation_frequency_pct"
    }
  }
}
4. Patterns With Proven Effect: Structure and Extractability
Across repeated, cleanly set up observations, a consistent pattern emerges: measures that directly improve the machine processability of content correlate more reliably with increased citation frequency than measures that only set superficial signals. This includes clearly structured semantic HTML with unambiguous question-answer mapping, valid structured data that redundantly repeats, machine-readably, the claims already made in the visible content, and consistent placement of the core claim at the start of every section.
The common denominator of these effective patterns is that they reduce the extraction work for a language model, rather than trying to set a ranking signal in the classic sense. This observation has a plausible explanation: a model with a limited context window tends to favor content that requires less interpretive effort, because the probability of a correct, precise reproduction is higher with clearly structured sources. This is no guarantee of effect for every individual page, but a pattern that repeats across many independent observations.
<!-- Structured data pattern that redundantly encodes the visible answer -->
<h3 id="what-does-geo-mean">What does GEO mean?</h3>
<p>GEO stands for Generative Engine Optimization and describes the optimization
of content for citation in AI-generated answers.</p>

<script type="application/ld+json">
{
  "@context": "https://schema.org",
  "@type": "DefinedTerm",
  "name": "GEO",
  "description": "Generative Engine Optimization: optimizing content for citation in AI-generated answers."
}
</script>
5. Patterns With Unclear Effect: Volume and Meta Tag Hacks
Not every popular GEO recommendation holds up under clean scrutiny. Pure content volume, meaning padding an article with additional words without structural improvement, shows no consistent effect on citation frequency in controlled comparisons, even though it occasionally correlates with increased visibility because longer articles also tend to be better structured. This spurious correlation tempts people to treat word count as an independent effective factor, when the actual cause is the accompanying structure.
Similarly unclear is the effect of pure meta tag adjustments, such as inserting certain keywords into the meta description, which language models do not weight the same way during retrieval as classic search algorithms do. Such measures are rarely harmful, but their isolated effect is hard to distinguish from noise in controlled comparisons. Anyone with limited budget should first invest in measures with a proven pattern before putting resources into tactics with an unclear evidence base.
6. Running an Internal GEO Test in Practice
A practical internal test combines the test group logic described in the third section with automated, repeated prompt execution. Before the change, a baseline period is defined in which both groups are observed for several weeks with the same prompt set, to capture the natural fluctuation range of citation frequency. Only afterward is the measure being tested applied to the test group, while the control group remains unchanged.
After the change, observation continues for a sufficiently long period, usually eight to twelve weeks, because training crawlers and live retrieval indexes do not react immediately to content changes. A statistical comparison of the two time series, for example via the difference in average citation frequency before and after the change in both groups, delivers a more solid result than a single before-and-after comparison without a control group.
#!/usr/bin/env bash
# geo-ab-test.sh, run the same prompt set against test and control groups
# and log results for later statistical comparison (simplified example)
set -euo pipefail

WEEK=$(date +%Y-W%V)
GROUPS=("test-group" "control-group")

for group in "${GROUPS[@]}"; do
  OUTPUT_FILE="geo-ab-logs/${group}-${WEEK}.json"
  mkdir -p geo-ab-logs

  while IFS= read -r prompt; do
    curl -s -X POST "https://api.example-ai-engine.com/v1/answer" \
      -H "Content-Type: application/json" \
      -d "{\"query\": \"$prompt\", \"group\": \"$group\"}" \
      >> "$OUTPUT_FILE"
  done < "prompts-${group}.txt"

  echo "Logged $group for $WEEK -> $OUTPUT_FILE"
done

# Weekly cron entry: run this script every Monday and feed results
# into a longitudinal comparison script for statistical evaluation
7. Assessing Publication Bias and Marketing Claims
Anyone reading publicly shared GEO case studies should account for systematic publication bias: positive results get published and shared, negative or neutral results rarely end up in a blog post or conference slide. A tool vendor selling a GEO tracking product also has a structural incentive to present case studies that demonstrate the benefit of their own product, regardless of how representative the individual case shown actually is.
A healthy screening grid for other people's GEO claims therefore systematically asks about sample size, the presence of a control group, the length of the observation period, and whether the author has a financial interest in a particular outcome. A claim that does not satisfactorily answer any of these four questions should be treated as a hypothesis, not a proven finding, no matter how convincing the individual anecdote sounds.
8. Time Horizons: Why GEO Effects Need Weeks to Months
A common mistake in internal GEO tests is too short an observation period. Live retrieval crawlers react comparatively quickly to content changes, but aggregating over a stable prompt set only smooths short term fluctuations into a reliable trend after several weeks. Training crawlers act even more slowly, since the content they collect only actually flows into generated answers with the next model update, which can take months.
These different time horizons mean that a GEO test aborted after two weeks without a visible effect may be prematurely classified as ineffective. A realistic test period separately accounts for the short term live retrieval effect, which can show up within four to eight weeks, and the long term training effect, which only becomes visible after several months and a model update and should be evaluated separately.
{
  "geo_effect_timeline": {
    "live_retrieval_effect": {
      "typical_onset_weeks": "4-8",
      "driver": "crawler re-fetches updated page"
    },
    "training_effect": {
      "typical_onset_weeks": "12+",
      "driver": "next model training cycle incorporates updated content"
    },
    "recommendation": "evaluate both windows separately, do not average them"
  }
}
9. A Scoring Grid for GEO Claims
The following table summarizes a pragmatic scoring grid for roughly assessing the strength of evidence behind a GEO claim, before a resource decision is built on it.
| Source Characteristic | Weak Evidence | Strong Evidence |
|---|---|---|
| Control Group | None | Present, comparable |
| Sample Size | Single page | Multiple domains/clusters |
| Observation Period | Under 2 weeks | 8+ weeks |
| Conflict of Interest | Sells a matching product | Independent or disclosed |
| Reproducibility | One-off observation | Repeatedly confirmed |
A GEO claim that lands predominantly in the right column deserves significantly more trust than a claim that mostly shows left column characteristics, regardless of how impressive the reported numbers sound.
Mironsoft
Controlled GEO tests, test group design and solid reporting
Want to know what actually works for your website?
We set up controlled GEO tests with test and control groups, define baseline periods, and deliver solid results instead of individual anecdotes for your next content decision.
Test Group Design
Set up comparable test and control groups for clean GEO tests
Longitudinal Measurement
Document baseline and observation periods over several weeks
Evidence-Based Reporting
Classify results with a scoring grid instead of marketing claims
10. Summary
Most publicly circulating GEO case studies provide no solid basis for your own decisions, because they lack control groups, sufficient sample sizes, and a critical examination of conflicts of interest. Solid GEO effect shows up reliably above all in measures that directly improve the machine extractability of content, while pure content volume and isolated meta tag adjustments show barely any consistent effect in controlled comparisons.
Anyone wanting to solidly evaluate their own GEO measures should define a test group and control group, plan a baseline period, adapt the observation period to the different time horizons of live retrieval and training, and consistently check other people's GEO case studies against the scoring grid described in the ninth section before using them as a basis for action.
Evaluating GEO Case Studies Correctly, the Essentials at a Glance
Correlation Is Not Causation
Temporal sequence alone proves no effect. Model updates and competitor behavior can explain the same change.
A Control Group Is Mandatory
A clean test compares a changed test group against an unchanged, comparable control group over the same period.
Structure Works More Reliably Than Volume
Measures that improve extractability show more consistent effects than simply padding word count.
Plan for Time
Live retrieval effects need weeks, training effects need months. Too short tests underestimate the actual effect.