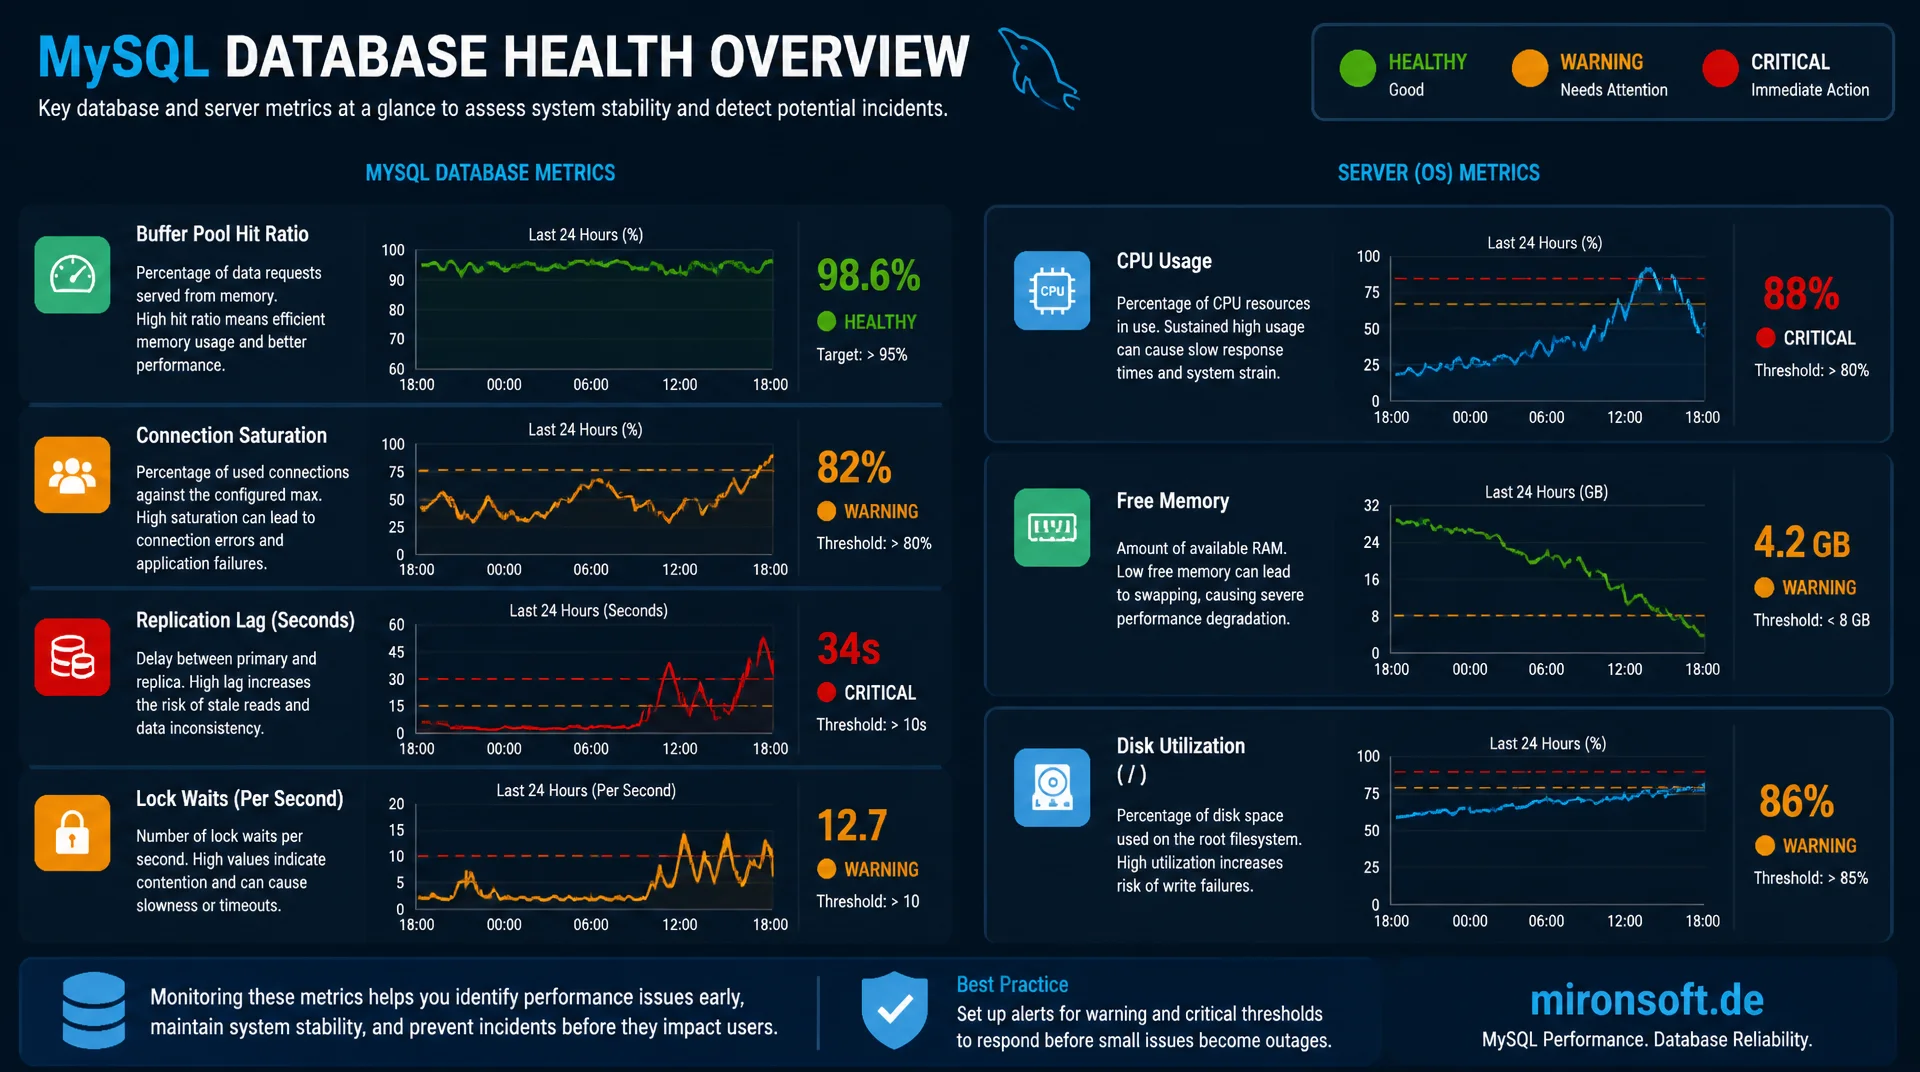
from buffer pool hit ratio to sensible alerting thresholds
CPU usage and free memory alone say almost nothing about the actual health of a MySQL database. Only buffer pool hit ratio, connection saturation, replication lag and lock waits together show whether a system is running stable or is about to hit an incident that classic server monitoring never sees.
Table of contents
- 1. Why the wrong metrics lead you astray
- 2. Assessing buffer pool hit ratio correctly
- 3. Connections and threads: detecting saturation
- 4. Measuring and interpreting replication lag
- 5. Monitoring lock waits and deadlocks
- 6. Performance Schema: basics and tables
- 7. Slow query log and query analysis
- 8. Setting sensible alerting thresholds
- 9. Dashboards: from raw data to action
- 10. Summary
- 11. FAQ
1. Why the wrong metrics lead you astray
Good MySQL monitoring starts with realizing that classic server metrics like CPU usage or free memory say almost nothing on their own about the actual health of a database. A MySQL instance can already suffer massively from lock contention at low CPU load, while an instance with high CPU usage might simply be handling many legitimate requests efficiently. Anyone measuring only at the system level misses exactly the problems that actually affect applications.
Meaningful MySQL monitoring therefore needs metrics that come from the database itself: how efficiently the buffer pool serves requests, how close the connection count is to the configured limit, how far replicas lag behind the primary, and how often transactions have to wait on each other. Together, these metrics form a picture that warns early enough to intervene before users notice an incident.
2. Assessing buffer pool hit ratio correctly
The InnoDB buffer pool keeps frequently used data and indexes in memory to avoid expensive disk access. The buffer pool hit ratio describes what share of read requests could be served directly from memory instead of loading a page from disk. A healthy value sits above 99 percent, anything below suggests the buffer pool is sized too small for the active dataset.
What matters for correct MySQL monitoring is not looking at the hit ratio in isolation but together with the absolute number of reads per second: a hit ratio of 98 percent at ten read requests per second is uncritical, the same ratio at ten thousand read requests per second means hundreds of disk accesses every second and can already cause noticeable latency. The size of innodb_buffer_pool_size should be based on the size of the active dataset, not a flat percentage of available memory.
-- Calculate the buffer pool hit ratio
SELECT
  (1 - (SELECT VARIABLE_VALUE FROM performance_schema.global_status
        WHERE VARIABLE_NAME = 'Innodb_buffer_pool_reads')
      / (SELECT VARIABLE_VALUE FROM performance_schema.global_status
        WHERE VARIABLE_NAME = 'Innodb_buffer_pool_read_requests')
  ) * 100 AS buffer_pool_hit_ratio_percent;

-- Check the current buffer pool size and utilization
SHOW VARIABLES LIKE 'innodb_buffer_pool_size';
SHOW STATUS LIKE 'Innodb_buffer_pool_pages_free';
SHOW STATUS LIKE 'Innodb_buffer_pool_pages_total';
3. Connections and threads: detecting saturation
A sudden spike in open connections is often the earliest visible sign of a problem, whether it is a slowing storage layer, a hanging application that does not close connections, or a traffic spike. The status variable Threads_connected relative to max_connections shows how close a system is to its configured limit. Once the limit is reached, MySQL rejects new connections outright, which is usually far worse for applications than increased latency.
For MySQL monitoring, Threads_running is also relevant: this number shows how many connections are actively executing a query right now, as opposed to Threads_connected, which also counts idle, merely open connections. A sharply rising Threads_running while Threads_connected stays flat points to a building query queue, often an early warning sign for approaching overload, long before max_connections is actually reached.
-- Connection saturation relative to the configured limit
SELECT
  (SELECT VARIABLE_VALUE FROM performance_schema.global_status
   WHERE VARIABLE_NAME = 'Threads_connected') AS connected,
  (SELECT VARIABLE_VALUE FROM performance_schema.global_variables
   WHERE VARIABLE_NAME = 'max_connections') AS max_conn,
  (SELECT VARIABLE_VALUE FROM performance_schema.global_status
   WHERE VARIABLE_NAME = 'Threads_running') AS running;

-- Inspect current processes and their state
SHOW FULL PROCESSLIST;
4. Measuring and interpreting replication lag
Replication lag describes how far a replica trails behind the transactions of the primary, usually measured in seconds. For applications with a read/write split, this is a critical metric in MySQL monitoring: a user who reads stale data from a lagging replica immediately after a write sees seemingly inconsistent data, even though the database is technically working correctly.
The classic metric Seconds_Behind_Master from SHOW SLAVE STATUS is a good first indicator, but can incorrectly show zero during network issues or when the IO thread itself hangs, even though the replica thread is actually far behind. With GTID enabled and the performance_schema replication tables, the actual lag can be determined more precisely through the timestamp of the last applied transaction, which is considerably more reliable for production MySQL monitoring.
-- Classic replication lag (run on the replica)
SHOW SLAVE STATUS\G
-- Relevant fields: Seconds_Behind_Master, Slave_IO_Running, Slave_SQL_Running

-- More precise lag through Performance Schema (GTID based)
SELECT
  CHANNEL_NAME,
  TIMESTAMPDIFF(SECOND, LAST_APPLIED_TRANSACTION_END_APPLY_TIMESTAMP, NOW()) AS lag_seconds
FROM performance_schema.replication_applier_status_by_worker;
5. Monitoring lock waits and deadlocks
Lock waits happen when a transaction waits for a row lock held by another, still running transaction. Occasional, short lock waits are normal in any transactional system, but a rising number of concurrent lock waits or a growing average wait time points to problematic access patterns, for example long running transactions that hold rows unnecessarily long.
For detailed MySQL monitoring of lock problems, the table performance_schema.data_lock_waits combined with data_locks shows exactly which transaction is waiting on which other one, including the respective query. InnoDB resolves deadlocks, where two transactions block each other, automatically by rolling back one of the two transactions. Frequent deadlocks in SHOW ENGINE INNODB STATUS are nonetheless a clear signal for transaction logic in the application that needs rework.
-- Identify currently blocked transactions and their blockers
SELECT
  waiting_pid, waiting_query, blocking_pid, blocking_query
FROM sys.innodb_lock_waits;

-- Check the number of deadlocks since the last server start
SHOW ENGINE INNODB STATUS\G
-- Look for the "LATEST DETECTED DEADLOCK" section
6. Performance Schema: basics and tables
The Performance Schema is the central instrumentation in MySQL for detailed MySQL monitoring at the level of individual statements, wait events and resources. It collects data with minimal overhead directly inside the server and exposes it through standard SQL queries, without requiring external agents to be installed on the database server. Important tables include events_statements_summary_by_digest for aggregated query statistics and table_io_waits_summary_by_table for I/O distribution per table.
Unlike the classic slow query log, the Performance Schema also captures fast but very frequently executed queries that together generate substantial load without any single execution standing out as slow. For production MySQL monitoring, combining the Performance Schema for aggregated trends with the slow query log for individual problematic statements is considerably more informative than either source alone.
7. Slow query log and query analysis
The slow query log records every query whose execution time exceeds a configured threshold, two seconds by default. For meaningful MySQL monitoring, this threshold should be set considerably lower, often to 100 to 500 milliseconds, since modern applications already produce noticeable latency for users at much shorter response times. The option log_queries_not_using_indexes adds queries that run a full table scan without an index to the slow query log.
Tools like pt-query-digest from Percona Toolkit aggregate the slow query log by query pattern and show which queries consume the most time in total, instead of just listing individual outliers. This aggregated view is usually far more valuable for prioritizing optimization work than the chronological raw list of the log.
# my.cnf: configure the slow query log for meaningful monitoring
[mysqld]
slow_query_log               = ON
slow_query_log_file           = /var/log/mysql/slow.log
long_query_time                = 0.2
log_queries_not_using_indexes  = ON
log_throttle_queries_not_using_indexes = 60

# Analysis with Percona Toolkit
# pt-query-digest /var/log/mysql/slow.log --limit=20
8. Setting sensible alerting thresholds
Alerting thresholds without any relation to actual system characteristics produce either missed incidents or alert fatigue from too many false alarms. Good MySQL monitoring sets thresholds relative to the normal operating behavior of the given system and distinguishes between a warning and a critical alert, instead of using one single rigid limit for everything.
The table below shows starting values that have proven themselves in production environments and can serve as a baseline for your own thresholds, adjusted to the respective workload.
| Metric | Healthy range | Warning | Critical |
|---|---|---|---|
| Buffer pool hit ratio | above 99 percent | 95 to 99 percent | below 95 percent |
| Threads_connected / max_connections | below 70 percent | 70 to 90 percent | above 90 percent |
| Replication lag | below 1 second | 1 to 10 seconds | above 10 seconds |
| Concurrent lock waits | below 5 | 5 to 20 | above 20 sustained |
| Deadlocks per hour | 0 to 1 | 2 to 10 | above 10 |
9. Dashboards: from raw data to action
A good MySQL monitoring dashboard does not just show raw values, it puts them into a context that enables a decision: is the buffer pool currently sufficient, is the connection count approaching the limit, how has replication lag developed over the last 24 hours. Time series are almost always more informative than snapshots, because they make trends visible before a threshold is crossed.
In practice, a combination of the MySQL exporter for Prometheus and prebuilt Grafana dashboards has proven itself, showing buffer pool, connections, replication lag and lock metrics on a shared timeline. It matters to regularly validate dashboards against actual incidents: if an incident was not visible in the dashboard afterward, a metric is missing and needs to be added.
Mironsoft
MySQL observability, performance analysis and operational safety
MySQL monitoring that shows problems before users notice them?
We set up Performance Schema based MySQL monitoring, define realistic alerting thresholds for your system, and build dashboards that translate raw data into clear action items.
Monitoring setup
Centrally capture buffer pool, connections, replication lag and lock metrics
Alerting design
Define thresholds matched to your workload to avoid alert fatigue
Dashboard build
Prometheus and Grafana dashboards that show trends instead of just snapshots
10. Summary
Effective MySQL monitoring does not rely on CPU usage or free memory alone, but on metrics from the database itself: buffer pool hit ratio for memory sizing, Threads_connected and Threads_running for connection saturation, replication lag for data consistency with read/write split, and lock waits for problematic transaction patterns.
The Performance Schema provides the data foundation for aggregated trends, the slow query log adds individual problematic statements. Only with realistic alerting thresholds matched to your own workload, and dashboards that show time series instead of snapshots, does a collection of metrics actually become effective MySQL monitoring.
MySQL Monitoring: the essentials at a glance
Buffer pool hit ratio
Above 99 percent is healthy, always assess it together with the absolute reads-per-second figure.
Connections and threads
Threads_running often rises earlier than Threads_connected and warns of approaching overload.
Replication lag
Seconds_Behind_Master as a first indicator, Performance Schema timestamps for precision.
Lock waits
data_lock_waits shows blockers and blocked transactions concretely, frequent deadlocks signal a need for rework.