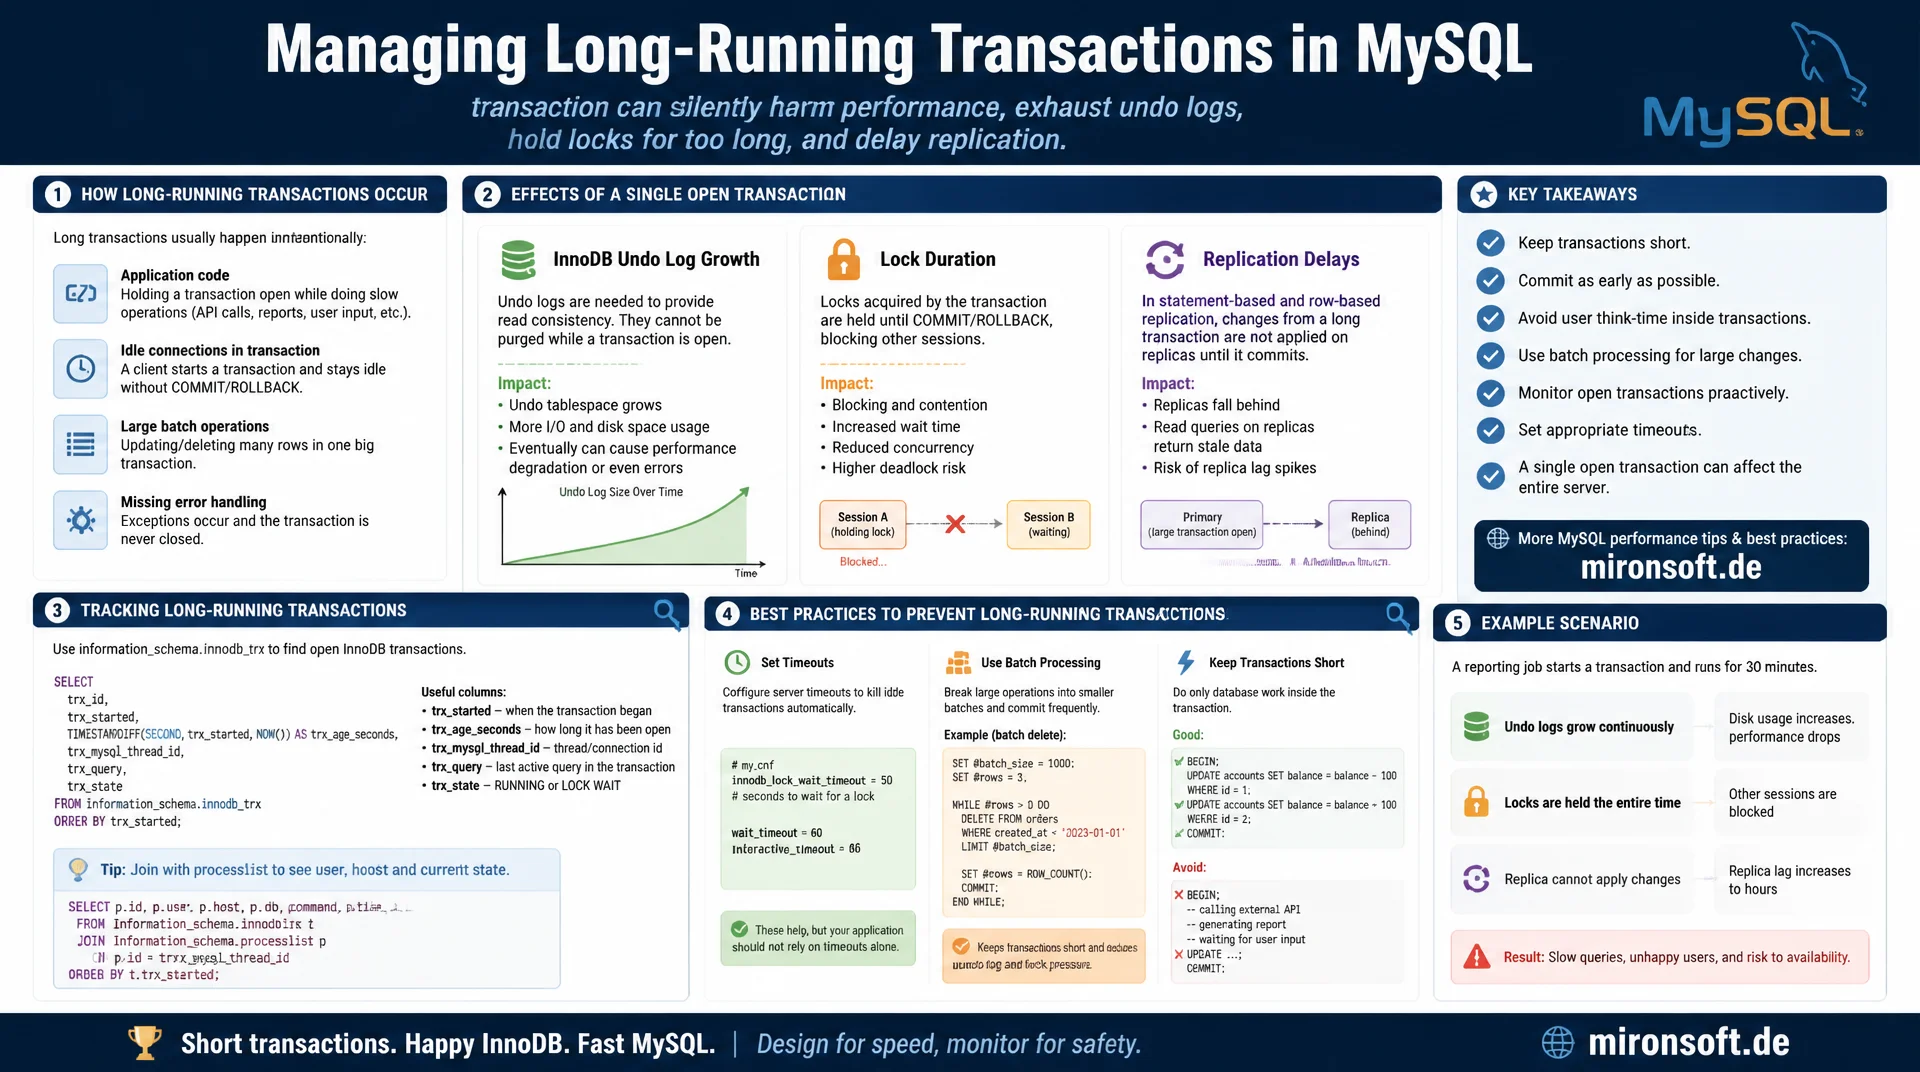
before they slow down the entire system
A single transaction left open can make the InnoDB undo log grow without bound, hold locks for minutes, and delay replication, without a single error message appearing anywhere. This article explains how long-running transactions arise in MySQL, how to reliably track them down with information_schema.innodb_trx, and which timeout and batch strategies prevent them in application code from the start.
Table of Contents
- 1. Why Long Transactions Become a Problem
- 2. How InnoDB Organizes Undo Logs and Purge
- 3. Finding Long-Running Transactions with innodb_trx
- 4. Analyzing Locks and Lock Waits with performance_schema
- 5. Application-Side Causes of Unnecessarily Long Transactions
- 6. Timeout Strategies: innodb_lock_wait_timeout and Application Logic
- 7. Batch Processing: Splitting Up Large Transactions Sensibly
- 8. Monitoring and Alerting for Long-Running Transactions
- 9. Symptoms, Causes, and Solutions at a Glance
- 10. Summary
- 11. FAQ
1. Why Long Transactions Become a Problem
A long-running transaction is not a transaction with a fixed time limit, but any transaction that stays open significantly longer than the actual business operation requires. A report accidentally running inside the same transaction as an import, a forgotten COMMIT in an interactive session, or a batch job processing ten thousand rows in a single pass: all three produce the same class of problems, even though the cause differs each time.
What makes a long-running transaction so treacherous is that it initially produces no visible errors. The application keeps running, queries return results, and only after minutes or hours do the consequences appear: growing tablespace files, blocked concurrent writes, and replication that falls further and further behind. The following sections show how InnoDB is technically burdened by long transactions and which concrete tools and patterns bring the problem under control.
2. How InnoDB Organizes Undo Logs and Purge
InnoDB uses an undo log for multi-version concurrency control, keeping the previous version of a row for every change made to it. This undo log lets concurrent transactions read a consistent snapshot of the data thanks to MVCC, without being affected by write access from other transactions. A background process, the purge thread, cleans up undo log entries as soon as no active transaction still needs an older snapshot in which that entry would need to remain visible.
A single long-running transaction prevents exactly this cleanup process. As long as the old transaction stays open, InnoDB must keep every undo log entry that could be relevant to its snapshot, even if thousands of other transactions commit in the meantime. The result is a steadily growing history list length, visible via SHOW ENGINE INNODB STATUS, which bloats the tablespace and measurably degrades read speed for all subsequent queries, because InnoDB has to walk longer version chains.
-- Check current InnoDB history list length (undo log growth indicator)
SHOW ENGINE INNODB STATUS\G
-- Look for: "History list length NNNN" in the TRANSACTIONS section

-- Alternative: query via information_schema (MySQL 8.0.30+)
SELECT NAME, COUNT
FROM information_schema.INNODB_METRICS
WHERE NAME = 'trx_rseg_history_len';
3. Finding Long-Running Transactions with innodb_trx
The table information_schema.innodb_trx lists all currently open InnoDB transactions with their start time, state, and associated thread ID. Using the trx_started column, the runtime of each transaction can be calculated, so long-running transactions can be filtered out specifically instead of manually scrolling through the process list. Combined with information_schema.processlist, you additionally get the last executed SQL statement of the respective connection.
This query should be a fixed part of any monitoring setup that wants to proactively detect long-running transactions, rather than only reacting once users complain about timeouts. In production environments, a threshold of a few minutes is a reasonable starting point for flagging a transaction as suspicious, depending on the typical workload of the respective application.
-- Find transactions running longer than 60 seconds
SELECT
  trx_id,
  trx_state,
  trx_started,
  TIMESTAMPDIFF(SECOND, trx_started, NOW()) AS duration_seconds,
  trx_mysql_thread_id,
  trx_query
FROM information_schema.innodb_trx
WHERE TIMESTAMPDIFF(SECOND, trx_started, NOW()) > 60
ORDER BY duration_seconds DESC;

-- Cross-reference with the full connection state
SELECT p.id, p.user, p.host, p.db, p.time, p.state, p.info
FROM information_schema.processlist p
JOIN information_schema.innodb_trx t ON t.trx_mysql_thread_id = p.id
WHERE t.trx_started < NOW() - INTERVAL 60 SECOND;
4. Analyzing Locks and Lock Waits with performance_schema
A long-running transaction is not only a problem for the undo log, it often also holds row locks that block other transactions. The performance_schema provides, through the tables data_locks and data_lock_waits, a detailed view of which transaction is waiting for a lock held by another transaction. In older MySQL versions, information_schema.innodb_lock_waits handled this task but was deprecated in favor of performance_schema.
Anyone who regularly finds blocked queries in the log should identify not just the blocked transaction but specifically the blocking transaction. Often that blocking transaction is exactly the long-running transaction that should have committed long ago. A targeted KILL of the blocking connection is acceptable as an emergency measure, but should always be followed by root cause analysis of why the transaction stayed open for so long.
-- Which transaction blocks which other transaction (MySQL 8.0+)
SELECT
  waiting_trx.trx_id AS waiting_trx_id,
  waiting_trx.trx_mysql_thread_id AS waiting_thread,
  blocking_trx.trx_id AS blocking_trx_id,
  blocking_trx.trx_mysql_thread_id AS blocking_thread,
  blocking_trx.trx_started AS blocking_since
FROM performance_schema.data_lock_waits w
JOIN information_schema.innodb_trx waiting_trx
  ON waiting_trx.trx_id = w.requesting_engine_transaction_id
JOIN information_schema.innodb_trx blocking_trx
  ON blocking_trx.trx_id = w.blocking_engine_transaction_id;
5. Application-Side Causes of Unnecessarily Long Transactions
The most common cause of a long-running transaction is not in the database but in the application code. A classic pattern: a transaction is opened, then an external HTTP call follows, for example to a payment provider or an email service, and only after the response is committed. As long as the external service is responding, the database transaction stays open, even though the actual database operation would have finished long ago. External network calls should fundamentally never happen inside an open transaction.
A second common cause is ORM behavior that implicitly keeps a transaction open while the application code still runs expensive calculations or loops with many individual operations. Interactive database sessions from developers who start with START TRANSACTION and then debug for minutes before committing or rolling back are also, in practice, among the most common sources of production-damaging long-running transactions, especially in staging and test environments that accidentally share the same server as production.
6. Timeout Strategies: innodb_lock_wait_timeout and Application Logic
The server parameter innodb_lock_wait_timeout limits how long a transaction waits for a lock before it is aborted with an error. The default value of 50 seconds is too high for many web applications, because a user should not have to wait 50 seconds for a blocked page. A lower, application-specific setting, for example via SET SESSION innodb_lock_wait_timeout = 5, forces fast feedback and prevents blocked connections from piling up in the connection pool.
In addition to the plain lock wait timeout, the application layer itself should enforce a maximum transaction duration, for example through a watchdog that logs open transactions after a defined time and, in extreme cases, closes the connection. This dual safeguard, database parameters and application logic together, reliably prevents a single faulty long-running transaction from staying open unnoticed for hours.
-- Session-level lock wait timeout, tighter than the global default
SET SESSION innodb_lock_wait_timeout = 5;

-- Check current global and session values
SHOW VARIABLES LIKE 'innodb_lock_wait_timeout';

-- Global setting for the whole server (requires SUPER privilege)
SET GLOBAL innodb_lock_wait_timeout = 15;
7. Batch Processing: Splitting Up Large Transactions Sensibly
A bulk update or import that processes tens of thousands of rows in a single transaction is one of the most common self-inflicted long-running transactions. The solution is batching: the total amount is split into smaller chunks, each chunk runs in its own short transaction with its own COMMIT. This drastically reduces the maximum lock duration per transaction and keeps the undo log small, because purge can clean up regularly between chunks.
What matters in batch processing is idempotency: if the process is aborted after a partial failure, it must be safely resumable without processing already handled rows a second time. A progress marker, typically the last processed ID, makes the batch process robust against interruptions and replaces the false safety of one giant transaction with genuine resumability.
<?php
declare(strict_types=1);

/**
 * Processes a large dataset in small, short-lived transactions
 * instead of one long-running transaction.
 */
function batchUpdatePrices(PDO $pdo, int $batchSize = 500): void
{
    $lastId = 0;

    while (true) {
        $pdo->beginTransaction();

        $stmt = $pdo->prepare(
            'SELECT id, price FROM product
             WHERE id > :last_id
             ORDER BY id ASC
             LIMIT :batch_size
             FOR UPDATE'
        );
        $stmt->bindValue('last_id', $lastId, PDO::PARAM_INT);
        $stmt->bindValue('batch_size', $batchSize, PDO::PARAM_INT);
        $stmt->execute();
        $rows = $stmt->fetchAll(PDO::FETCH_ASSOC);

        if (count($rows) === 0) {
            $pdo->commit();
            break; // no more rows left
        }

        $update = $pdo->prepare('UPDATE product SET price = price * 1.05 WHERE id = :id');
        foreach ($rows as $row) {
            $update->execute(['id' => $row['id']]);
            $lastId = (int) $row['id'];
        }

        $pdo->commit(); // short transaction, released immediately
    }
}
8. Monitoring and Alerting for Long-Running Transactions
Reactive debugging is not enough for long-running transactions, because the damage has already occurred by the time it is discovered. A monitoring job that queries information_schema.innodb_trx at regular intervals and alerts when a threshold is exceeded detects the problem before users notice it through timeouts. Tools like Percona Monitoring and Management or a simple cron job with email dispatch serve this purpose equally well.
In addition, the history list length from SHOW ENGINE INNODB STATUS should feed into a monitoring dashboard as a metric. A continuously rising value over several hours is a reliable early warning signal for a long-running transaction hanging somewhere, even if the specific transaction is not obviously long at the moment of observation but keeps recurring periodically and never fully clears.
9. Symptoms, Causes, and Solutions at a Glance
The following table maps typical symptoms of long-running transactions to their most common causes and the matching countermeasure, as a quick reference for troubleshooting in production.
| Symptom | Likely cause | Countermeasure |
|---|---|---|
| Growing tablespace files | Undo log cannot be purged | Check innodb_trx for open transactions |
| Slow SELECT queries | Long version chains from high history list length | Identify the purge blocker and let it commit |
| Lock wait timeouts in the log | External API call inside an open transaction | Keep network calls strictly outside transactions |
| Replication lag | Bulk update in a single transaction | Batch processing with small transactions |
| Connection pool exhausted | Default innodb_lock_wait_timeout too high | Lower session timeout for the application |
This mapping does not replace deeper diagnosis, but it gives you a quick starting point in an acute situation to move from an observed symptom to the most likely cause of a long-running transaction, before larger damage occurs.
10. Summary
Long-running transactions are dangerous because they initially stay unnoticed while, in the background, they bloat the undo log, hold locks, and delay replication. The table information_schema.innodb_trx is the first tool for making open transactions and their runtime visible, complemented by performance_schema.data_lock_waits for analyzing concrete blockages. The most common cause lies in application code: external network calls inside open transactions and bulk updates without batching.
Effective countermeasures combine database configuration and application design: a lower innodb_lock_wait_timeout, consistent batching of large data volumes into short transactions, and continuous monitoring of the history list length as an early warning system. Anyone who considers these three layers together prevents a single forgotten transaction from becoming a bottleneck for the entire system.
Avoiding long-running transactions, the essentials at a glance
Finding them
Regularly check information_schema.innodb_trx for high-runtime transactions, combined with the process list.
Avoiding causes
Never make external network calls inside an open transaction. Always split bulk updates into batches.
Setting timeouts
Set an application-specific innodb_lock_wait_timeout well below the global default of 50 seconds.
Monitoring
Track history list length as a metric on the monitoring dashboard, as an early warning signal for hanging transactions.