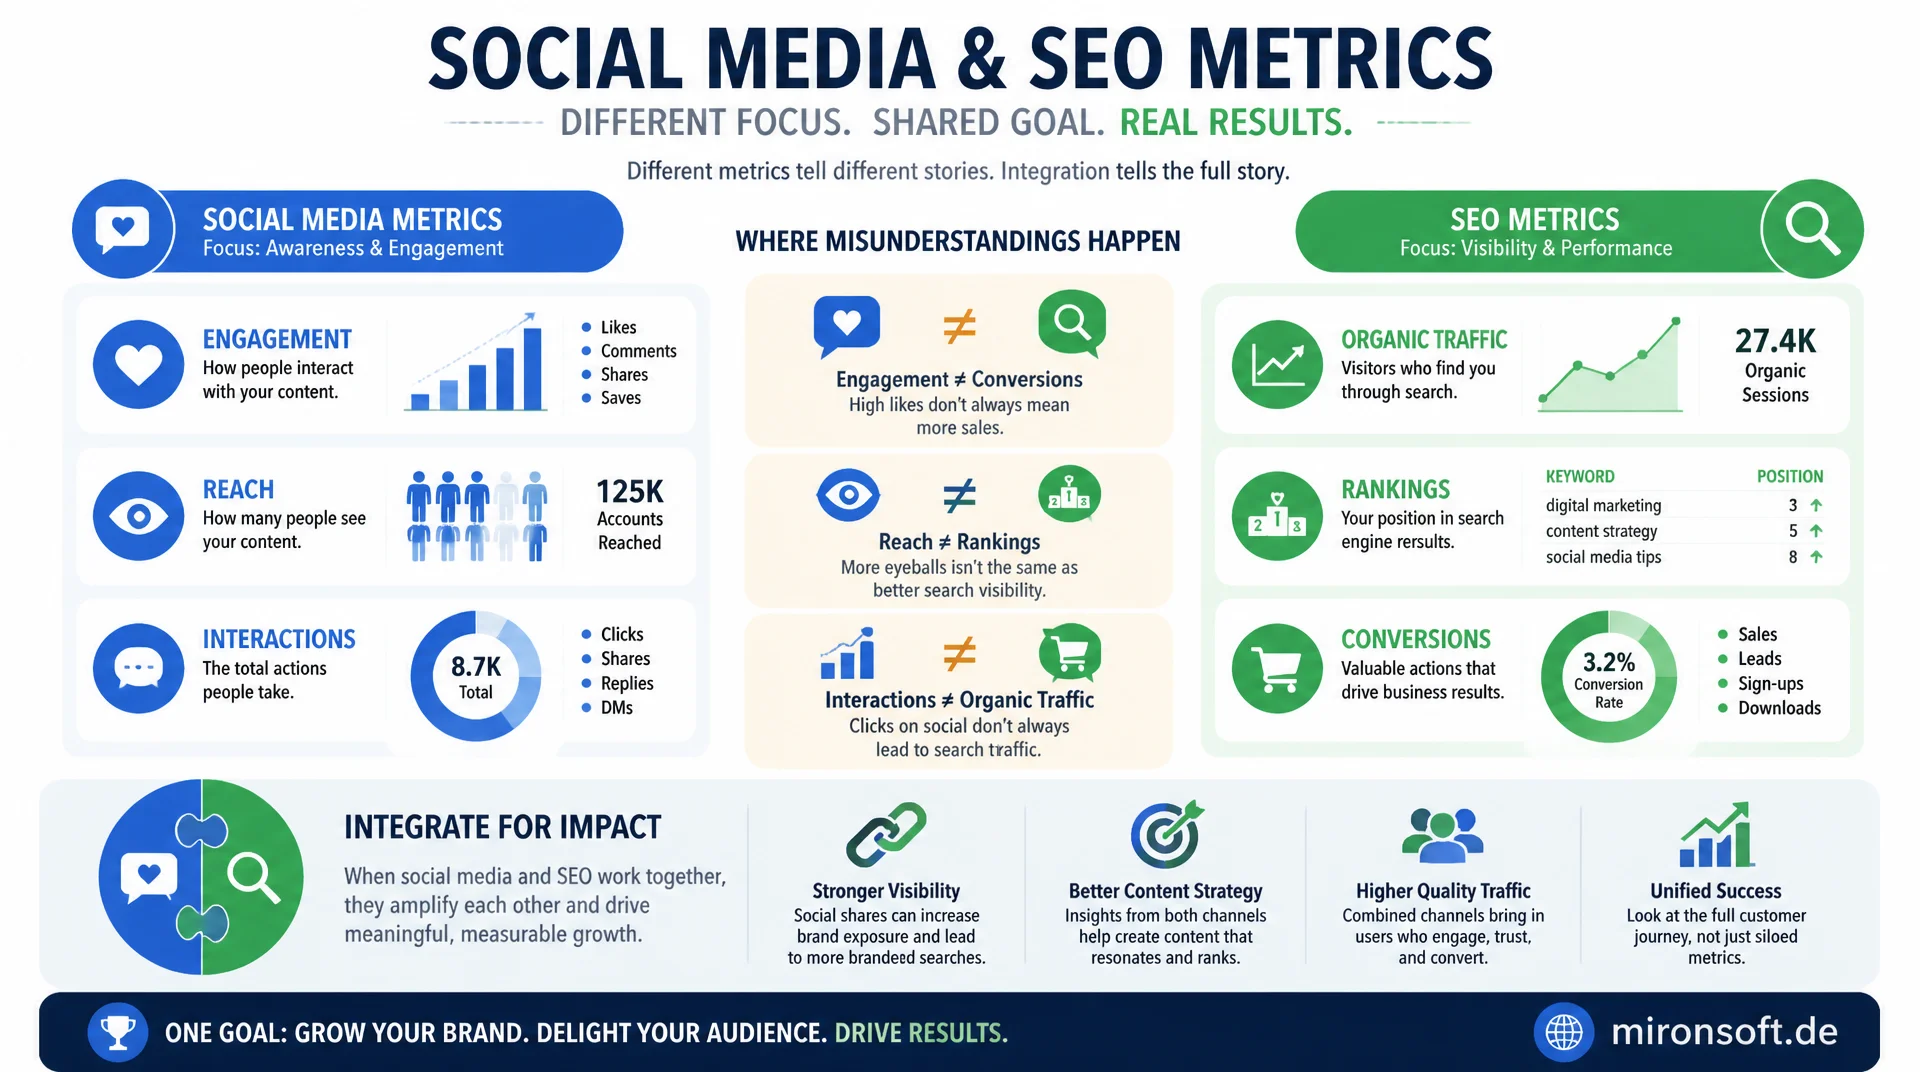
a shared reporting framework for both worlds
Social media teams measure success through engagement, reach and interaction, SEO teams through organic traffic, rankings and conversions. These different success metrics frequently lead to misunderstandings in shared reporting and prevent both channels from being evaluated as one connected system.
Table of Contents
- 1. Why social media KPIs and SEO KPIs answer different questions
- 2. The most important social media KPIs in detail
- 3. The most important SEO KPIs in detail
- 4. Common misunderstandings between the two KPI worlds
- 5. Building a shared reporting framework
- 6. Tracking setup: UTM parameters and attribution
- 7. Implementing a cross-channel dashboard technically
- 8. Anchoring it organizationally within the team
- 9. Social media KPIs and SEO KPIs compared directly
- 10. Summary
- 11. FAQ
1. Why social media KPIs and SEO KPIs answer different questions
Social media KPIs and SEO KPIs get presented in the same meeting at many companies, yet they fundamentally answer different questions. Social media KPIs answer: how strongly is our audience interacting with our content right now. SEO KPIs answer: how well are we found for relevant search queries, and how much of that leads to an action. These questions are not opposed, but they measure different phases of the customer journey with different temporal dynamics.
In practice, this leads to a widespread reporting problem: a social media post with a high engagement rate gets celebrated as a success even though it generated almost no organic traffic, while an unremarkable but steadily ranking blog article without much social media attention delivers the bulk of conversions. Without a shared framework that relates both metric worlds to each other, wrong conclusions about the actual effectiveness of individual channels emerge.
The first step toward functioning cross-channel reporting is therefore not searching for a single universal metric, but consciously understanding that social media KPIs and SEO KPIs deliver complementary, not competing, signals that together produce a more complete picture of marketing success than either metric group alone.
2. The most important social media KPIs in detail
Engagement rate, defined as the ratio of interactions to reach or followers, is the central social media KPI, because it measures how relevant a piece of content was to the audience it actually reached. A high engagement rate signals that content generates resonance, independent of absolute reach. Reach and impressions, by contrast, show how many people saw a piece of content at all, regardless of whether they reacted.
Share of voice measures a brand's share of the total conversation within an industry or topic area and is thus one of the few social media KPIs with a direct connection to the brand authority discussed later. Click-through rate on links in social media posts is the most important bridge to SEO metrics, because it directly measures how much traffic from social media activity actually flows to your own website and thereby potentially turns into SEO-relevant user signals.
{
  "social_media_kpis_monthly": {
    "channel": "linkedin",
    "period": "2026-06",
    "impressions": 84200,
    "engagement_rate_percent": 4.7,
    "share_of_voice_percent": 12.3,
    "link_clicks": 1340,
    "click_through_rate_percent": 1.6
  }
}
3. The most important SEO KPIs in detail
Organic traffic is the most fundamental SEO KPI and measures how many visitors reach the website through unpaid search results. Unlike social media reach, organic traffic is a more direct signal of active interest, because users actively searched for a term instead of passively seeing content in a feed. Keyword rankings complement this metric by showing for which specific search terms a page is visible, and how that position develops over time.
Conversion rate from organic traffic is the SEO KPI with the most direct business relevance, because it shows how many of the organically acquired visitors actually take a desired action, a purchase, an inquiry, or a newsletter signup. Backlink growth and domain authority are more structural SEO KPIs that reflect a domain's long-term competitiveness in search results, without having a direct short-term traffic impact.
{
  "seo_kpis_monthly": {
    "period": "2026-06",
    "organic_sessions": 18450,
    "avg_keyword_position": 8.4,
    "organic_conversion_rate_percent": 2.9,
    "new_backlinks": 34,
    "domain_authority_score": 47
  }
}
4. Common misunderstandings between the two KPI worlds
The most common misunderstanding occurs when social media success is measured directly against SEO success, even though the temporal dynamics are completely different. A viral social media post can generate thousands of interactions within hours, while an SEO effect from the same content, for example through resulting backlinks or increased brand awareness, only shows up in ranking data weeks or months later. Anyone who expects both metrics side by side in the same weekly report will inevitably be disappointed.
A second widespread misunderstanding is the assumption that social media signals are direct Google ranking factors. That is not accurate in this simple form: social media activity works primarily indirectly, through increased brand awareness, more backlinks resulting from higher visibility, and more branded search, not through a direct algorithmic connection between like counts and search ranking. This distinction matters for setting realistic expectations about cross-channel effects.
5. Building a shared reporting framework
A functioning cross-channel framework does not rank KPIs on a shared leaderboard, but organizes them into a shared journey structure: awareness metrics, which include social media reach and impressions as well as organic visibility for non-brand keywords, engagement metrics, which include social media interaction rates and organic time on page, and conversion metrics, which include both social traffic conversions and organic conversions. This structure makes visible at which point in the journey each channel makes its biggest contribution.
A consistent timeline logic is also crucial: social media KPIs should be viewed in shorter intervals, such as weekly, because trends show up faster there, while SEO KPIs are more sensibly evaluated in monthly or quarterly intervals, to correctly account for seasonal fluctuations and the inherent delay of ranking changes. A shared dashboard that displays both timelines side by side, instead of artificially synchronizing them, avoids misinterpretation.
{
  "journey_kpi_structure": {
    "awareness": ["social_reach", "organic_impressions_non_brand"],
    "engagement": ["social_engagement_rate", "organic_time_on_page"],
    "conversion": ["social_assisted_conversions", "organic_conversion_rate"]
  }
}
6. Tracking setup: UTM parameters and attribution
The technical bridge between social media KPIs and SEO KPIs is built through consistent UTM tracking on all social media links. Only with clean UTM parameters can an analytics tool reliably distinguish which traffic comes from organic search and which from social media activity, and how users from both sources behave differently going forward. Without this tracking, both sources blur together in aggregated referrer data and any cross-channel analysis loses its explanatory power.
Attribution models play an additional role, because many customer journeys pass through multiple channels: a user sees a social media post, but only returns days later via organic search to convert. A last-click attribution model would attribute this success entirely to organic search and ignore the initial social media touchpoint. A data-driven or at least linear attribution model represents such multi-channel journeys more realistically.
<!-- UTM example for a LinkedIn post linking to the blog article -->
<a href="https://mironsoft.de/blog/seo2-social-media-kpis-vs-seo-kpis-en?utm_source=linkedin&utm_medium=social&utm_campaign=seo2_launch&utm_content=kpi_framework_post">
  Read the article
</a>
7. Implementing a cross-channel dashboard technically
A practical cross-channel dashboard combines data from social media analytics APIs and Google Search Console or a comparable SEO tool into a shared data basis from which both KPI groups can be visualized side by side. It is important to display each metric on its own, appropriate timeline instead of artificially forcing all values into the same weekly rhythm, so the different response speed of both channels remains correctly visible.
For teams without a dedicated business intelligence tool, a structured spreadsheet with automated data import via the respective APIs is often sufficient, supplemented with clearly defined formulas for derived metrics such as social-to-organic assist rate, meaning the share of organic conversions where a prior social media touchpoint could be traced in the journey.
{
  "cross_channel_dashboard_config": {
    "awareness_metrics": ["social_impressions", "organic_impressions_non_brand"],
    "engagement_metrics": ["social_engagement_rate", "organic_avg_session_duration"],
    "conversion_metrics": ["social_assisted_conversions", "organic_conversions"],
    "refresh_interval": { "social": "weekly", "seo": "monthly" }
  }
}
8. Anchoring it organizationally within the team
A shared KPI framework only works if it is organizationally anchored and not managed in separate team silos. A monthly cross-channel review attended by both social media and SEO leads creates the space to interpret metric developments together, instead of presenting them in isolated separate reports that the other side rarely reads.
It also helps to establish a shared, clearly defined vocabulary for derived success metrics, for example a company-wide unified definition of "content success" that takes into account both social media engagement and downstream organic traffic contribution. Without this shared definition, different teams often evaluate the same piece of content completely differently, depending on which metric group falls under their own area of responsibility.
9. Social media KPIs and SEO KPIs compared directly
The following overview contrasts the key properties of both metric worlds to establish the basis for realistic, shared reporting.
| Property | Social media KPIs | SEO KPIs |
|---|---|---|
| Temporal dynamics | Fast, often visible within hours | Slow, usually weeks to months |
| Main focus | Interaction and reach | Discoverability and conversion |
| Optimal reporting interval | Weekly | Monthly to quarterly |
| Example metric | Engagement rate | Organic traffic |
| Connection to business result | Mostly indirect, via awareness | Mostly direct, via conversion |
The table makes it clear: both metric groups complement each other along the customer journey rather than replacing one another. A shared framework that explicitly accounts for these different timelines and focus points delivers a considerably more complete picture than either metric group considered in isolation.
For practical implementation, it is advisable to start with a small number of metrics per group, for example three awareness, engagement and conversion metrics each, instead of building an overloaded dashboard with twenty individual values from the start. A lean framework that is maintained consistently delivers more reliable decision-making ground long-term than a comprehensive system that stops being updated after a few months due to lack of capacity.
The framework should also be reviewed and adjusted regularly whenever business goals or channel priorities shift, so the measured metrics keep answering the questions that are actually relevant for both the social media and SEO teams alike.
Mironsoft
Cross-channel reporting, tracking setup and KPI frameworks
One shared reporting view for social media and SEO?
We build your UTM tracking, attribution model and cross-channel dashboard so social media and SEO KPIs finally become comparable, instead of contradicting each other in separate reports.
Tracking audit
Checking UTM structure and attribution model for consistency
Dashboard setup
Cross-channel dashboard with the right timeline per KPI group
Team alignment
Establishing a shared KPI language between social media and SEO teams
10. Summary
Social media KPIs and SEO KPIs measure complementary, not competing, dimensions of marketing success. Engagement rate and reach answer how strongly content resonates in the moment, organic traffic and conversion rate answer how sustainably visibility translates into concrete business results. Anyone who brings both metric groups together in a shared framework with the right timeline and consistent UTM tracking gains a considerably more complete picture than viewing them in isolation.
The decisive organizational step is not managing both metric groups in separate team silos, but bringing them together in a shared, regular review. That way, social media activity and SEO results get evaluated not against each other, but as one connected system across the entire customer journey.
Social media KPIs vs. SEO KPIs, the key points at a glance
Different focus
Social media KPIs measure interaction and reach, SEO KPIs measure discoverability and conversion.
Different timelines
Social media effects show up fast, SEO effects need weeks to months for reliable trends.
Technical bridge
Consistent UTM tracking and a suitable attribution model measurably connect both metric worlds.
Organizational anchor
A shared cross-channel review instead of separate reports per team silo.