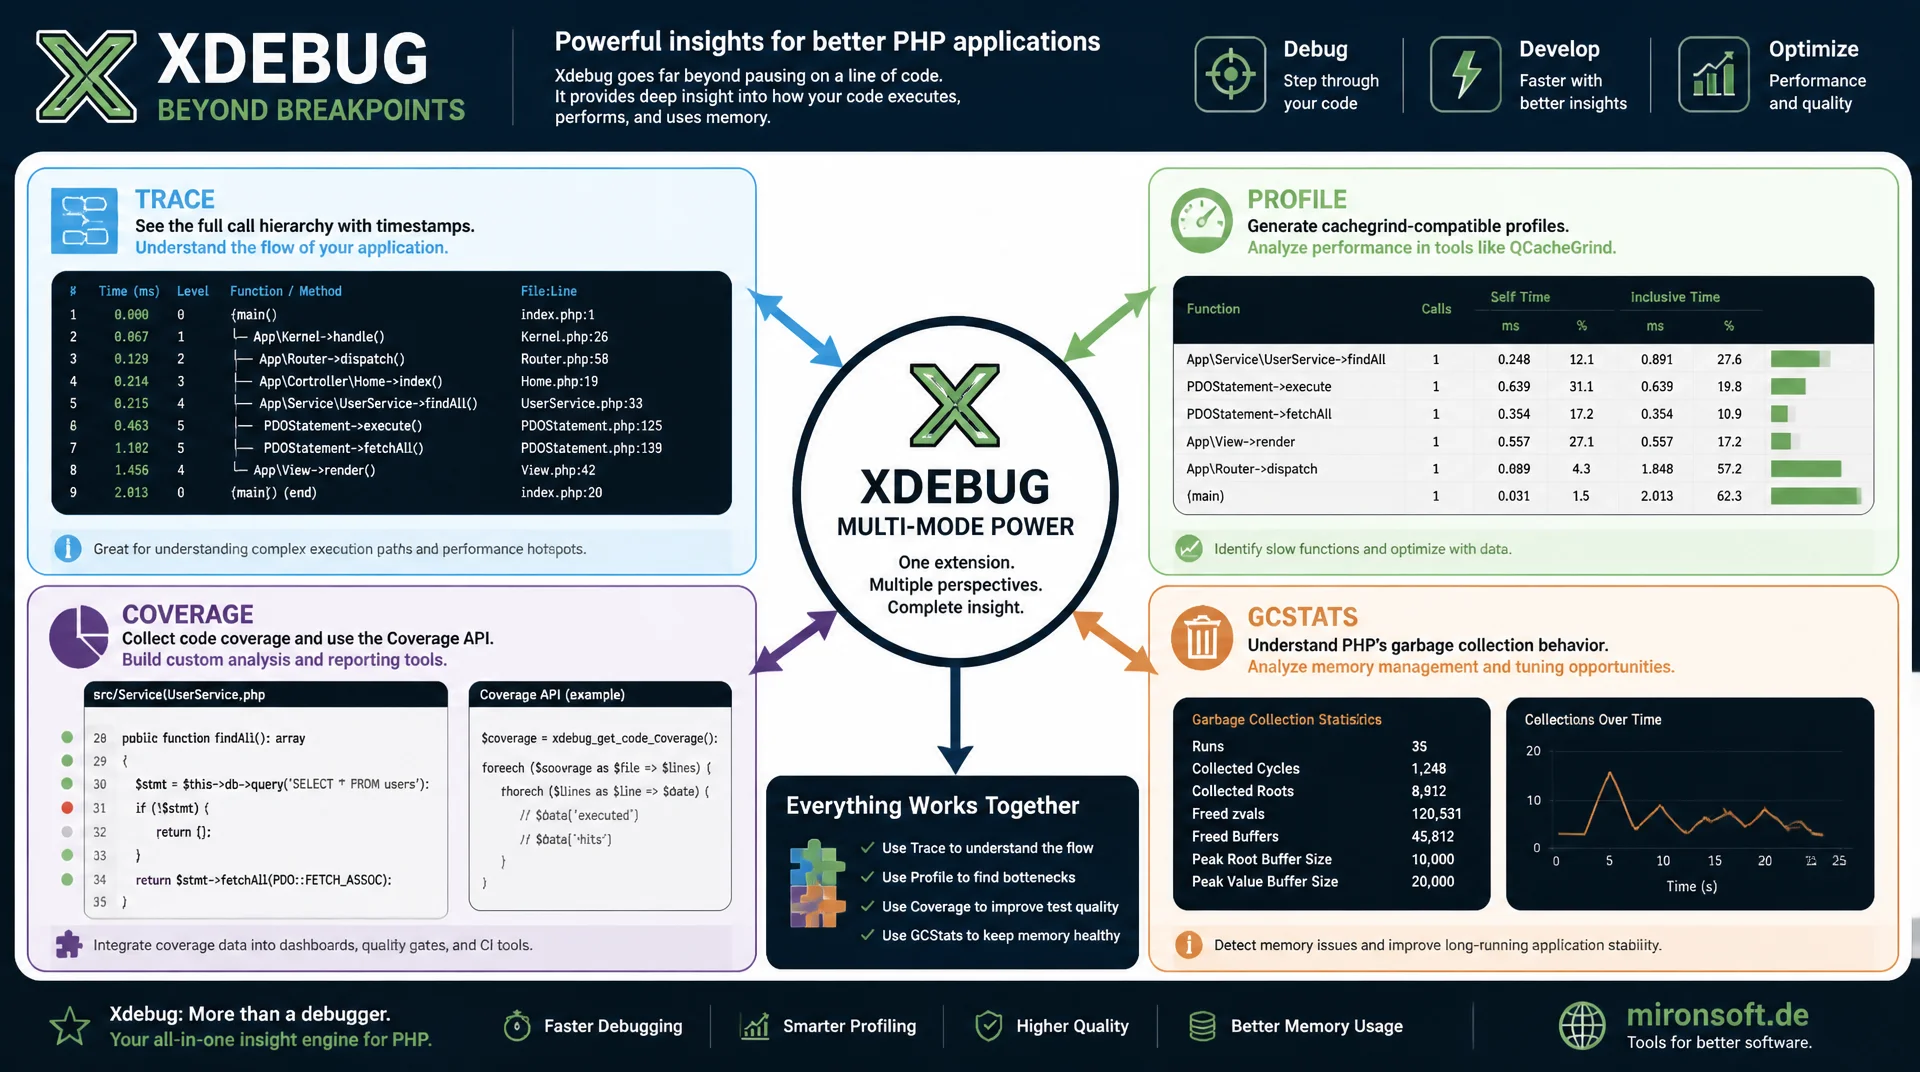
Profiling, Trace and Coverage for Deep PHP Analysis
Xdebug can do far more than pause execution on a line. With the modes trace, profile, coverage and gcstats, Xdebug opens an analysis window into the real runtime state of a PHP request: call hierarchies with timestamps, cachegrind profiles for self time and inclusive time, a coverage API for custom analysis tools, and garbage collection statistics that normally stay completely hidden.
Table of Contents
- 1. The Xdebug Modes at a Glance
- 2. Configuring xdebug.mode and xdebug.start_with_request
- 3. Function Trace: Call Hierarchy with Timestamps
- 4. Code Coverage API Beyond PHPUnit
- 5. Profiling with Cachegrind Output
- 6. GC Stats: Making Garbage Collection Visible
- 7. Selective Activation with xdebug.trigger_value
- 8. Performance Overhead of Each Mode
- 9. Practical Example: Identifying a Hot Path via Trace File
- 10. Summary
- 11. FAQ
1. The Xdebug Modes at a Glance
Since Xdebug 3, the extension no longer runs as a monolithic debugger but as a collection of individually activatable modes. Each mode unlocks exactly one capability: develop provides better var_dump() output, stack traces on errors, and warnings for problematic function calls. debug activates the classic DBGp protocol for breakpoint sessions in an IDE, the well known part of Xdebug. Four other modes often go unused day to day, even though they are at least as valuable for performance analysis and quality assurance: trace logs every function call to a file, profile produces cachegrind compatible profiles, coverage exposes a programmatic API for code coverage, and gcstats makes the garbage collector's behavior visible.
The modes combine freely because xdebug.mode accepts a comma separated list. xdebug.mode=develop,trace activates better error messages and function call tracing at the same time, for the same request. In practice, combining more than two modes at once is rare, since the overhead stacks and the output files become unwieldy. It is important to understand that Xdebug itself does not decide which mode is the right one for a given task, that remains a deliberate decision by the developer depending on the question at hand, whether it concerns a slow request, unclear test coverage, or a suspected memory leak situation.
2. Configuring xdebug.mode and xdebug.start_with_request
Configuration happens centrally through php.ini, or a dedicated xdebug.ini in the conf.d directory. The two most important directives are xdebug.mode, which modes are loaded at all, and xdebug.start_with_request, whether Xdebug activates automatically on every request or only after an explicit trigger. The difference matters for operations: xdebug.start_with_request=yes activates the configured modes on every single request, which is unproblematic on a local development machine but quickly causes noticeable slowdowns for every user on a shared staging system.
The value trigger reverses this behavior: Xdebug stays inactive until a cookie, GET parameter, or header named XDEBUG_TRIGGER is present in the request. This lets Xdebug stay loaded permanently on a staging server without every request automatically carrying the overhead. Only when explicitly triggered does the desired mode become active, for exactly that one request. This distinction between "loaded" and "active" is the core of a production adjacent Xdebug setup and is covered in more depth in section 7.
; php.ini / conf.d/xdebug.ini

; Multiple modes, comma separated, can be active at once
xdebug.mode = develop,trace,profile

; yes = active on every request, trigger = only on XDEBUG_TRIGGER
xdebug.start_with_request = trigger

; Target directories for trace and profile files
xdebug.trace_output_dir = /var/log/xdebug/traces
xdebug.output_dir = /var/log/xdebug/profiles

; Human readable trace format (0) instead of binary (1) or HTML (2)
xdebug.trace_format = 0

; Cachegrind file name including PID and timestamp
xdebug.output_name = cachegrind.out.%p.%t

; Name of the trigger value that the cookie/GET/header must contain
xdebug.trigger_value = STAGING_PROFILE
On production systems, Xdebug should generally not be loaded at all, since even with the trigger configuration, a minimal overhead remains from the loaded extension code. For staging environments, however, the combination of xdebug.mode with several values and xdebug.start_with_request=trigger is the standard approach for keeping Xdebug available at all times without it interfering with every request unasked.
3. Function Trace: Call Hierarchy with Timestamps
The trace mode logs every single function and method call of a request to a file in the directory set by xdebug.trace_output_dir. Each line contains nesting depth, a timestamp relative to request start, memory consumption, the function name, and the parameter values passed. When a function is left, Xdebug additionally logs the return value, provided xdebug.trace_format=0 is set, the text based, human readable format. This level of detail makes traces the most precise tool for understanding exactly in which order and with which arguments code was actually executed, without a single breakpoint interruption in the running process.
The call hierarchy shows through indentation: a more deeply nested call appears with more leading whitespace, making recursion depth and branching visible at a glance. The per line timestamps are cumulative from request start, so the difference between entry and exit of a function yields its actual runtime including all sub calls. This information is the real advantage over a breakpoint session: instead of manually stepping through the code line by line, a complete, searchable recording is available once the request finishes.
$ cat /var/log/xdebug/traces/trace.1234567.xt

TRACE START [2026-07-23 09:14:02.001234]
    0.0002     393216   -> {main}() /app/public/index.php:0
    0.0004     401920     -> App\Http\Kernel->handle() /app/public/index.php:12
    0.0006     412160       -> App\Order\OrderRepository->findRecent() /app/src/Order/OrderRepository.php:28
        >>> \$customerId = 4821
        >>> \$limit = 25
    0.0031     498304         -> PDO->prepare() /app/src/Order/OrderRepository.php:34
    0.0089     512000         -> PDOStatement->execute() /app/src/Order/OrderRepository.php:35
    0.0142     540672       -> App\Order\OrderRepository->findRecent() returns array(25 items)
    0.0145     541200     -> App\Http\Kernel->handle() returns App\Http\Response
TRACE END   [2026-07-23 09:14:02.019812]
This excerpt immediately shows that findRecent() alone takes 13.6 milliseconds (0.0142 minus 0.0006), while the actual SQL execution via PDOStatement->execute() accounts for 5.3 milliseconds of that. Exactly this kind of observation, which a breakpoint session could only deliver step by step and without an overall picture, makes function trace the preferred tool for the first narrowing down of a slow request.
4. Code Coverage API Beyond PHPUnit
PHPUnit is the best known consumer of the Xdebug coverage API, but the functions xdebug_start_code_coverage() and xdebug_get_code_coverage() can also be called directly in your own code, without any test framework at all. This is useful, for instance, to track which code lines a specific production request actually executes, which legacy functions a single CLI command touches, or to build an internal analysis tool for dead code lines. The return value of xdebug_get_code_coverage() is an array that maps line numbers to their status per file: one for executed, minus two for not executable, minus one for executable but not reached.
In addition to simple line coverage, the coverage mode supports two extended options. XDEBUG_CC_BRANCH_CHECK provides branch and path coverage, that is, which branches of a condition were actually taken, not just whether the line was executed at all. XDEBUG_CC_UNUSED marks lines that were never reached, while XDEBUG_CC_DEAD_CODE additionally identifies unreachable code, for example after a return statement. These flags are passed as a bitmask to the second parameter of xdebug_start_code_coverage().
<?php

declare(strict_types=1);

// Programmatic coverage collection without a test framework
xdebug_start_code_coverage(XDEBUG_CC_UNUSED | XDEBUG_CC_BRANCH_CHECK);

require __DIR__ . '/bootstrap.php';
$app = new Application();
$app->handle($_SERVER);

$coverage = xdebug_get_code_coverage();
xdebug_stop_code_coverage();

$report = [];
foreach ($coverage as $file => $lines) {
    $executed = array_filter($lines, static fn (int $status): bool => $status === 1);
    $unreached = array_filter($lines, static fn (int $status): bool => $status === -1);

    $report[$file] = [
        'executed_lines' => count($executed),
        'unreached_lines' => count($unreached),
    ];
}

// Persist as JSON for a custom analysis dashboard, independent of PHPUnit
file_put_contents(
    '/var/log/coverage/request-' . uniqid() . '.json',
    json_encode($report, JSON_PRETTY_PRINT)
);
This technique is especially well suited to production adjacent analysis: a middleware hook starts coverage collection at request start and writes a compact report at request end, aggregated across many requests it becomes visible which share of a large codebase is ever actually executed in real operation. For such continuous observation, however, coverage mode should only be active on a single canary server, since this mode also produces measurable overhead.
5. Profiling with Cachegrind Output
The profile mode writes a file in cachegrind format for every request into the directory set by xdebug.output_dir. This format was originally developed by Valgrind for the C world and is understood by a whole range of analysis tools, without any IDE being involved. On a Linux desktop, kcachegrind (or the platform independent variant qcachegrind) opens the file graphically with call graphs and sortable function lists. Anyone without a desktop with a graphical interface, for example on a remote server, uses callgrind_annotate from the Valgrind package directly on the command line for a text based analysis.
The central interpretation key of every cachegrind profile is the distinction between self time and inclusive time. Self time measures exclusively the time spent inside the function's own code, not counting time spent in called sub functions. Inclusive time sums the time of the function and all functions it calls together. A function with high inclusive time but low self time is usually just a thin wrapper that passes most of the time on to deeper calls, while a function with high self time is itself the actual bottleneck worth optimizing.
$ ls /var/log/xdebug/profiles/
cachegrind.out.48213.1753253642

$ callgrind_annotate --auto=yes /var/log/xdebug/profiles/cachegrind.out.48213.1753253642 | head -20

--------------------------------------------------------------------------------
Profile data file 'cachegrind.out.48213.1753253642' (creator: xdebug)
--------------------------------------------------------------------------------
Summary: 184532910

Ir            file:function
184532910     PROGRAM TOTALS

    ms       Self (ms)     Inclusive (ms)    Calls    file:function
     -            2.10            142.30        1     index.php:App\Http\Kernel->handle
     -            0.85            118.40        1     OrderRepository.php:findRecent
     -          104.90            104.90    18420     PriceCalculator.php:calculateTax  (self time hot path)
     -            8.60             12.30       25     OrderRepository.php:hydrate
In this example, calculateTax() stands out immediately: 104.9 milliseconds of self time across 18,420 calls, practically identical to its inclusive time, meaning the function spends its entire time in its own code and calls nothing significant further. That is the classic fingerprint of a function being called far too often inside a loop, for instance because a result is not being cached. Without a cachegrind profile, this insight would be almost impossible to derive from reading source code alone.
6. GC Stats: Making Garbage Collection Visible
The gcstats mode is the least known of the Xdebug modes, since PHP's cyclic garbage collector rarely gets attention in daily work unless a memory problem occurs. When xdebug.mode=gcstats is enabled, Xdebug writes a file at the end of every request that logs how often the garbage collector performed cycle detection, how many root buffer entries were processed during that, and how many memory cycles were actually identified as unreachable and freed.
These numbers become relevant when a request unexpectedly consumes a lot of memory or takes noticeably long, even though the trace profile shows no obvious hot path. A high number of detected cycles points to many circular references, typically through objects that reference each other, classically in observer patterns, Doctrine entities with bidirectional relationships, or event listener structures without weak references. The GC has to actively resolve these cycles, which costs CPU time that does not show up in the plain trace as its own function call, but rather appears as a hard to attribute delay between two lines.
7. Selective Activation with xdebug.trigger_value
On a staging environment with multiple concurrent users, it would be impractical to activate Xdebug for every request. The directive xdebug.trigger_value solves this by specifying exactly which value the cookie, GET parameter, or header XDEBUG_TRIGGER must carry for Xdebug to become active at all. If the value is left empty, Xdebug accepts any non empty trigger, which is a security risk on a shared system, since anyone who knows the header name could profile arbitrary requests. With a concrete, project specific value such as STAGING_PROFILE, the trigger effectively becomes a simple access key.
For daily use, a single header or cookie set in the browser, via a browser extension or manually with curl, is enough. Since only the single marked request activates the chosen mode, the rest of the traffic on the staging system remains fully unaffected, even if xdebug.mode=develop,trace,profile is permanently set in the configuration. This exact combination of loaded modes plus a targeted trigger is the professional middle ground between "Xdebug is never available" and "Xdebug slows down every request".
# Trace and profile mode triggered for exactly this one request via header
$ curl -H "X-Xdebug-Trigger: STAGING_PROFILE" \
       -H "Cookie: XDEBUG_TRIGGER=STAGING_PROFILE" \
       https://staging.example.com/checkout/cart

# Alternative: GET parameter, useful for quick ad hoc checks in a browser tab
$ curl "https://staging.example.com/checkout/cart?XDEBUG_TRIGGER=STAGING_PROFILE"

# Resulting files appear only for this single request
$ ls -la /var/log/xdebug/traces/ /var/log/xdebug/profiles/
trace.stagingweb01.1753253642.xt
cachegrind.out.stagingweb01.1753253642
8. Performance Overhead of Each Mode
Not every Xdebug mode costs the same amount of runtime. develop and debug without an active session stay nearly free, since they only do extra work on actual errors or when an IDE session is connected. gcstats is likewise cheap, since only a few counters get evaluated at request end. coverage sits in the middle, depending on whether branch checking is enabled. The two most expensive modes are trace and profile: both instrument every single function call in the process, write at least one line to a file per call or update an internal counter tree, and can slow request duration down by a factor of three to ten depending on the codebase.
For that reason, trace and profile strictly belong on staging systems or local development environments, never permanently on production servers. Even with xdebug.start_with_request=trigger, a single triggered production request remains a real risk if it happens to hit a resource intensive endpoint and thereby delays other requests on the same worker. Clean isolation is achieved either through a dedicated canary host that receives mirrored traffic, or through a local copy of production data in a staging environment where trace and profile sessions can run without risk to real users.
| Mode | Purpose | Performance Overhead | Typical Environment |
|---|---|---|---|
trace |
Call hierarchy with parameters, return values, timestamps | Very high | Staging, local |
profile |
Cachegrind profiles for self/inclusive time | Very high | Staging, local |
coverage |
Line, branch and path coverage, programmatic | Medium | CI, staging (canary) |
gcstats |
Garbage collection cycles and memory freed | Low | Staging, targeted |
debug |
Interactive breakpoint session via DBGp | Medium (only with active session) | Local |
9. Practical Example: Identifying a Hot Path via Trace File
A concrete scenario illustrates how the modes work together: a reporting endpoint suddenly takes 4 seconds on staging instead of the usual 300 milliseconds, after a recursive function for computing nested category trees was added. The first step is to activate xdebug.mode=trace via trigger for exactly this one request and open the resulting .xt file. Even a quick look at the indentation depth reveals a strikingly deep, repeating nesting of the same function buildCategoryTree(), which points to unexpectedly high recursion depth.
The second step is a targeted text search in the trace file for the function name: counting the occurrences of buildCategoryTree() quickly shows whether the function was called ten times or ten thousand times. In this case, it was over 40,000 calls for a tree with only 200 nodes, a clear sign of missing memoization: the same subtree was repeatedly recomputed instead of reusing an already computed result. The parameter values in the trace file confirmed this, the same node ID showed up repeatedly with identical arguments.
The third step switches to xdebug.mode=profile to quantify self time precisely: the cachegrind profile showed buildCategoryTree() with the highest inclusive time in the entire request, but comparatively low self time, a clear sign that the function itself is not inefficient, rather the sheer number of calls is the problem. After adding a simple result cache within the request, the call count dropped from 40,000 to around 200, and request time fell to 280 milliseconds. Without the trace file, the call count would have been almost impossible to measure, and without the cachegrind profile it would have remained unclear whether the function itself or its call frequency was the actual problem.
10. Summary
Xdebug is far more than a breakpoint debugger for the IDE. The modes trace, profile, coverage and gcstats open up four completely different views on the same request flow: the exact call hierarchy with timestamps, a cachegrind profile for self and inclusive time, a programmatic coverage API for custom analysis tools, and garbage collection statistics for hidden memory problems. Each of these modes answers a different question, and none of them fully replaces the classic breakpoint session, they complement each other depending on the symptom.
Using Xdebug professionally means applying these modes deliberately and with a clear target: configured through xdebug.mode in php.ini, controlled through xdebug.start_with_request=trigger and xdebug.trigger_value, exclusively on staging systems or locally, never permanently in production. Anyone who maintains this discipline gains, with Xdebug, an analysis tool that goes far beyond pausing on a single line and answers deep performance and quality questions with concrete, reproducible data.
Xdebug Beyond Breakpoints: The Essentials at a Glance
Function Trace
xdebug.mode=trace logs every function call with parameters, return values, and timestamps to a file, with no breakpoints at all.
Cachegrind Profiling
xdebug.mode=profile produces profiles for kcachegrind, qcachegrind, or callgrind_annotate, with a clear split between self and inclusive time.
Coverage API
xdebug_start_code_coverage() and xdebug_get_code_coverage() enable custom analysis tools beyond PHPUnit.
Selective Activation
xdebug.start_with_request=trigger plus xdebug.trigger_value keeps staging systems unaffected for all other requests.
11. FAQ: Xdebug Beyond Breakpoints
1Difference between develop and debug?
2Enable multiple modes at once?
3What does xdebug.start_with_request=trigger do?
4How do you read a trace file?
5Coverage API usable without PHPUnit?
6Analyze a cachegrind file without an IDE?
7Self time vs. inclusive time?
8What does gcstats show?
9Selective activation on staging?
10Why are trace and profile so slow?
Mironsoft
PHP performance analysis, profiling, and deep debugging
PHP applications that stay analyzable under load?
We set up Xdebug trace, cachegrind profiling, and the coverage API cleanly on staging environments, identify hot paths, and deliver concrete, measurable optimizations for your PHP codebase.
Performance Audit
Trace and cachegrind analysis of existing hot paths with concrete numbers
Staging Setup
Xdebug modes and trigger configuration with no risk to production traffic
Coverage Tooling
Custom analysis tools built on the Xdebug coverage API beyond PHPUnit