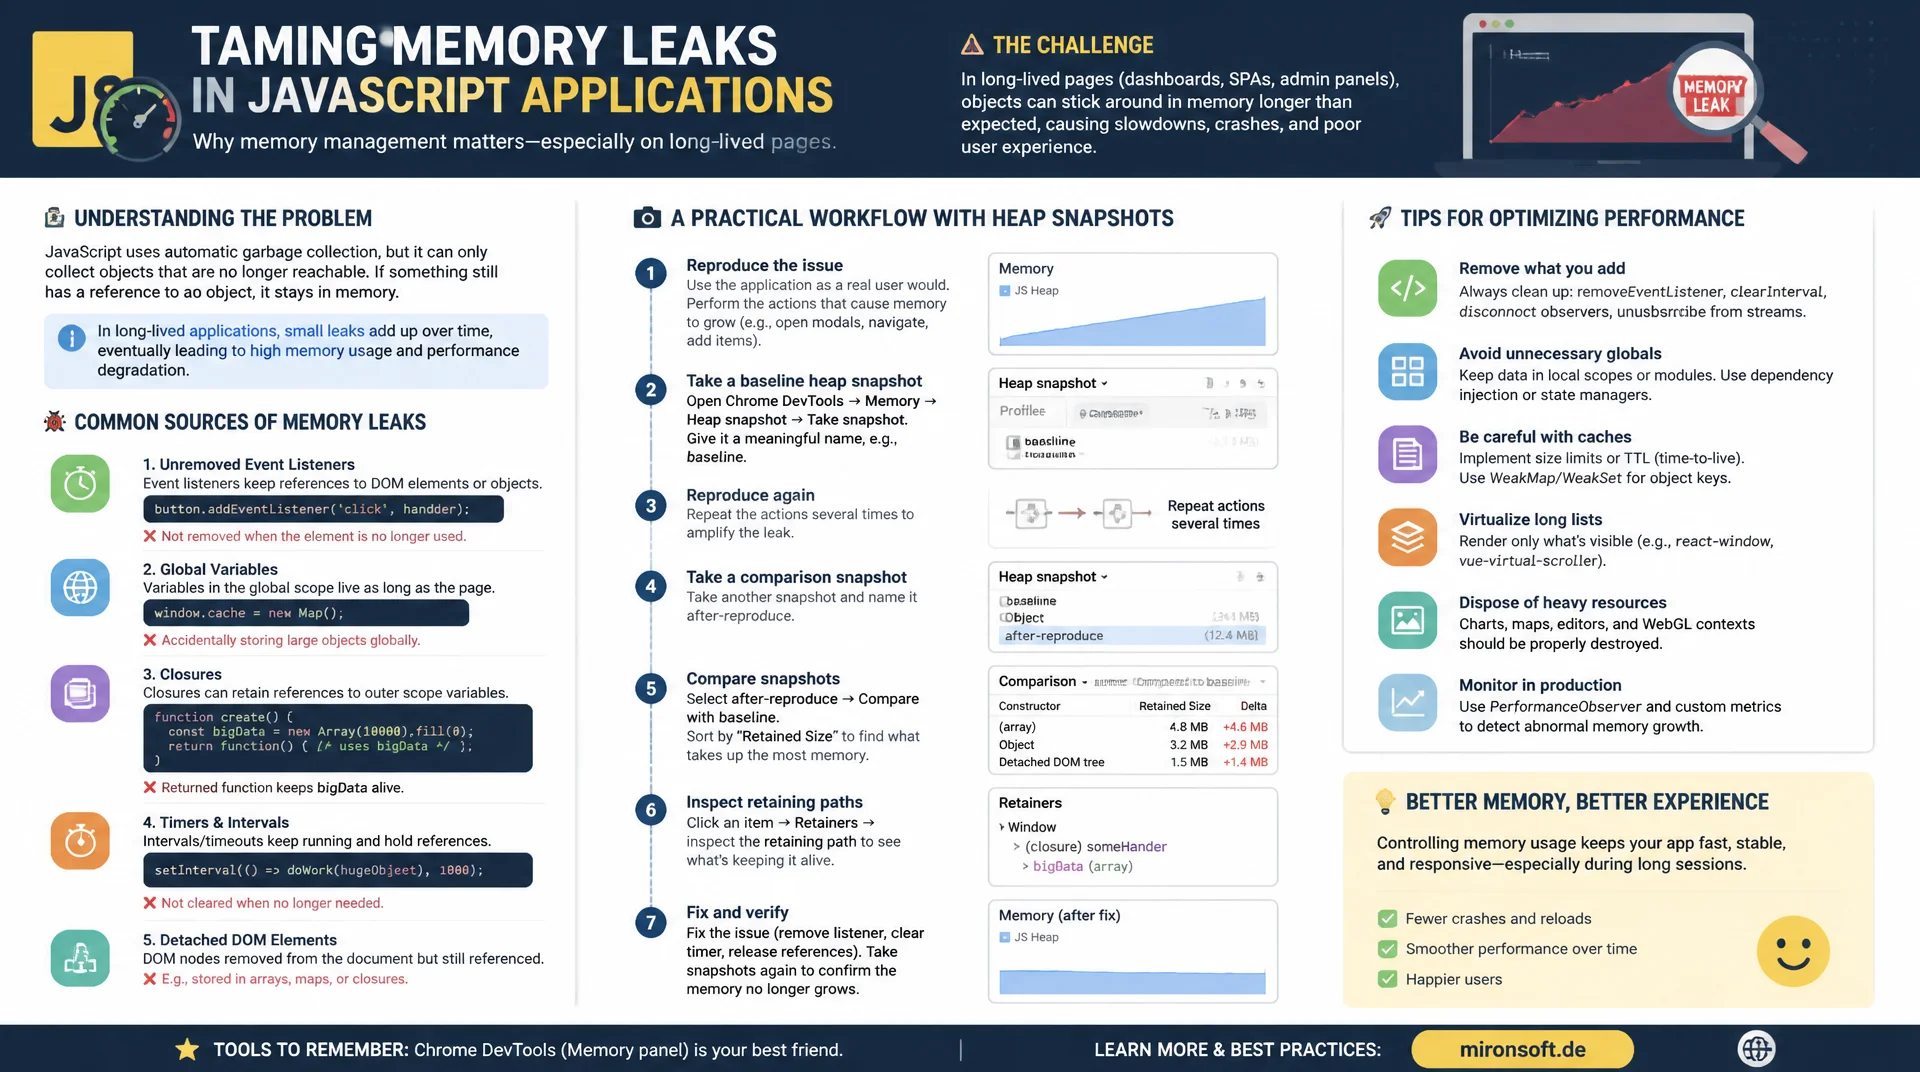
Detached DOM nodes, event listeners, and closures under control
Growing memory usage, sluggish interactions, and browser tabs that crash after hours: JavaScript applications with long lived pages frequently suffer from memory leaks that only become noticeable over time. This article covers the most common leak sources, practical use of heap snapshots in Chrome DevTools, and a step by step debugging workflow that reliably locates and fixes leaks.
Table of Contents
- 1. Why memory leaks happen in JavaScript applications
- 2. Detached DOM nodes: when references block the garbage collector
- 3. Forgotten event listeners as the most common leak source
- 4. Closures and unintended references
- 5. Global variables and cache accumulation
- 6. Chrome DevTools: capturing and comparing heap snapshots
- 7. Using the allocation instrumentation timeline
- 8. SPA characteristics and Alpine.js components compared
- 9. Debugging workflow and leak patterns compared
- 10. Summary
- 11. FAQ
1. Why memory leaks happen in JavaScript applications
A memory leak in JavaScript doesn't happen because the garbage collector is broken, it happens because an object stays reachable through a forgotten reference chain even though the application no longer needs it. V8 uses a generational mark and sweep strategy: anything reachable from a GC root survives, regardless of whether it's actually still used. That exact gap between "reachable" and "actually needed" is the root of almost every leak in production frontend code.
The problem rarely becomes visible right away. Typical symptoms are a steadily growing JS heap in the Chrome Task Manager, interactions that noticeably slow down after extended use, and in extreme cases a tab that crashes after several hours of an open session. Admin dashboards, single page applications, and PWA storefronts that keep users on the same page for hours without a full reload are especially affected. Classic, server rendered Magento storefronts are structurally less exposed, since every navigation resets the entire JavaScript heap, though individual, long lived widgets can still accumulate memory over the course of a session.
2. Detached DOM nodes: when references block the garbage collector
A detached DOM node is an element that has been removed from the visible document tree but is still reachable through a JavaScript reference, for example in an array, a map, or a closure variable. The browser can only free the associated memory once no reference remains at all. In Magento frontends this typically happens with dynamically loaded product cards or modal dialogs: an event handler stores a reference to the modal element in a variable outside the modal's scope, the modal is removed from the DOM via remove(), but the reference lives on.
Detached DOM nodes are easy to spot in a Chrome DevTools heap snapshot: the "Detached" filter in the summary view shows exactly these objects, often prefixed with Detached HTMLDivElement. Clicking such an object reveals the retainer path, the exact chain of references keeping the element alive. This path is the single most useful debugging clue, since it shows not only that a leak exists, but also which specific variable or closure scope is responsible for it.
// Leak: removed DOM node stays referenced in a module-level cache
const modalCache = [];

function openModal(html) {
  const modal = document.createElement('div');
  modal.innerHTML = html;
  document.body.appendChild(modal);
  modalCache.push(modal); // reference survives the DOM removal
  return modal;
}

function closeModal(modal) {
  modal.remove(); // removed from DOM, but still reachable via modalCache
}

// Fix: drop the reference once the element is actually closed
function closeModalFixed(modal) {
  modal.remove();
  const index = modalCache.indexOf(modal);
  if (index !== -1) {
    modalCache.splice(index, 1); // let the garbage collector reclaim it
  }
}
3. Forgotten event listeners as the most common leak source
Forgotten event listeners are probably the most common leak source in interactive JavaScript applications, because addEventListener by default holds a firm reference to the handler and everything the handler captures via closure inside the DOM element. If the element is removed from the DOM without removing the listener first with removeEventListener, the entire reference chain stays intact as long as any other part of the application still holds a reference to the element, for example via a global event bus or a resize observer instance.
Listeners on window, document, or a global event bus are especially tricky, because these objects themselves never go away. Any component that registers a listener on window and forgets to remove it during its own teardown leaves behind a handler that fires on every subsequent event, keeping the entire closure scope of a component that's no longer visible alive. The more modern, considerably more robust approach is a single AbortController signal per component that removes every registered listener at once with a single abort() call during teardown, instead of tracking each one individually.
// Leak: listener keeps the whole component instance reachable
function initProductGallery(el) {
  const state = { zoomed: false };

  window.addEventListener('resize', () => {
    state.zoomed = false; // closure keeps `state` and `el` alive forever
    renderGallery(el, state);
  });
}

// Fix: bind every listener to one AbortController, abort on teardown
function initProductGalleryFixed(el) {
  const controller = new AbortController();
  const state = { zoomed: false };

  window.addEventListener('resize', () => {
    state.zoomed = false;
    renderGallery(el, state);
  }, { signal: controller.signal });

  return () => controller.abort(); // single call removes every listener
}
4. Closures and unintended references
Closures aren't a leak pattern by themselves, they're a fundamental JavaScript feature, but they turn into a leak source the moment a function captures more from its surrounding scope than it actually needs. If a callback function accidentally captures a large object from a parent scope, for example because both are declared in the same function body, V8 keeps the entire object in memory for as long as the callback itself stays reachable, even if the callback only ever uses a single field from it.
The pattern shows up frequently with setTimeout, setInterval, and promise callbacks that are never cleaned up. A setInterval that isn't stopped with clearInterval when a view is left keeps its entire closure scope alive for the lifetime of the application, even after the associated page or component has long since stopped existing. The rule of thumb against closure leaks: extract only the values actually needed into a new, small variable via destructuring instead of carrying the whole surrounding object into the callback, and explicitly clean up every timer, interval, and subscription object during teardown.
// Leak: the interval closure keeps the entire `pageState` object alive
function startPolling(pageState) {
  setInterval(() => {
    // Only `pageState.orderId` is used, but the whole object stays reachable
    fetchOrderStatus(pageState.orderId);
  }, 5000);
}

// Fix: extract only what is needed and always clear the interval
function startPollingFixed(orderId) {
  const intervalId = setInterval(() => {
    fetchOrderStatus(orderId); // only a primitive value is captured
  }, 5000);

  return () => clearInterval(intervalId); // caller must invoke on teardown
}
5. Global variables and cache accumulation
Global variables and module wide caches are the slowest but most stubborn leak type, because they don't come from one single faulty line of code but from a missing upper bound. A cache object that stores API responses keyed by request path grows without limit on every new, unique request, because nobody ever removes old entries. Over hours or days that adds up to several hundred megabytes the garbage collector can't touch, because the cache object itself stays permanently reachable.
The most effective safeguard is a WeakMap instead of a regular Map or a plain object, whenever the keys are DOM elements or other objects that should be able to disappear independently of the cache: entries in a WeakMap are removed automatically once the key itself is no longer referenced anywhere else. For caches with primitive keys like strings, only an explicit upper bound helps, for example an LRU strategy that discards the oldest entries once a defined maximum size is reached.
6. Chrome DevTools: capturing and comparing heap snapshots
The heap snapshot workflow in Chrome DevTools starts in the Memory tab with the Heap snapshot profiling type. The first step is always to freeze the state before the suspected leak action: load the page, wait for all initial requests, then capture snapshot 1. Next, the suspicious action is repeated several times, for example opening and closing a modal ten times or navigating between two category pages ten times, before capturing snapshot 2. Repetition matters, because a one time leak gets lost in the noise of normal allocations, while a leak repeated ten times stands out clearly as a pattern in the comparison.
The actual analysis happens in the Comparison view between snapshot 1 and snapshot 2, sorted by #Delta descending. Any row with a clearly positive delta for constructors like HTMLDivElement, closure functions, or custom class names is a candidate. Clicking the row opens the instance list, and clicking a single instance shows the retainer tree in the panel below, exactly the reference chain keeping the object reachable. That tree, read from the bottom up, almost always leads straight to the responsible line of code.
{
  "comparisonView": {
    "snapshot1": "before-10x-modal-open-close",
    "snapshot2": "after-10x-modal-open-close",
    "sortedBy": "#Delta",
    "rows": [
      { "constructor": "Detached HTMLDivElement", "new": 10, "deleted": 0, "delta": 10, "allocSizeDelta": "184 kB" },
      { "constructor": "(closure) openModal", "new": 10, "deleted": 0, "delta": 10, "allocSizeDelta": "42 kB" },
      { "constructor": "Array", "new": 12, "deleted": 2, "delta": 10, "allocSizeDelta": "8 kB" }
    ]
  },
  "interpretation": "Ten repeated actions produced ten retained detached nodes, a 1:1 ratio confirms a leak, not GC noise"
}
7. Using the allocation instrumentation timeline
While heap snapshots show a state at one point in time, the Allocation instrumentation on timeline recording continuously tracks when which objects get allocated while the recording runs. The result is a bar chart over time, where every blue bar represents a group of allocations. Bars that stay blue instead of turning gray after the action completes mark objects that were never released, meaning potential leak candidates, while gray colored bars indicate allocations already collected by the garbage collector and no longer a concern.
This view is especially valuable for correlating the exact moment of an allocation with a specific user action, for example a single click on a filter button. Selecting a narrow time window in the bar chart narrows the object list down to exactly the allocations created in that moment, which speeds up debugging considerably compared to the coarser comparison of two snapshots, particularly for leaks triggered by a single, clearly identifiable interaction.
8. SPA characteristics and Alpine.js components compared
SPA style applications and long lived components are structurally more exposed to leaks than classic, server rendered page navigation, because every full page navigation in the browser discards the entire JavaScript heap along with it, every reference, every timer, and every event listener from the previous page. A classic Magento storefront without client side routing automatically benefits from this reset on every click of a category or product link, even if individual scripts on the previous page were technically broken.
Alpine.js components in Hyvä themes are mostly short lived, because they're bound to DOM elements that get discarded during normal Magento navigation anyway. It only becomes critical with components that deliberately live across multiple interactions, for example a mini cart widget repeatedly shown and hidden via x-if with its own setInterval for price refreshes: when the component is removed via x-if, Alpine automatically runs every watcher and effect cleanup, but a setInterval or a window addEventListener registered manually in x-init only gets cleaned up if the component explicitly registers a cleanup via $cleanup(callback).
<!-- Alpine.js component with explicit teardown via $cleanup -->
<div
    x-data="miniCartWidget()"
    x-init="init()"
>
  <span x-text="formattedTotal"></span>
</div>

<script>
function miniCartWidget() {
  return {
    formattedTotal: '0.00 USD',
    init() {
      const intervalId = setInterval(() => this.refreshTotal(), 15000);
      const onStorage = (event) => this.syncFromStorage(event);
      window.addEventListener('storage', onStorage);

      // Runs automatically when Alpine removes this element (e.g. via x-if)
      this.$cleanup(() => {
        clearInterval(intervalId);
        window.removeEventListener('storage', onStorage);
      });
    },
    refreshTotal() { /* ... */ },
    syncFromStorage(event) { /* ... */ }
  };
}
</script>
9. Debugging workflow and leak patterns compared
A reproducible debugging workflow doesn't start in the code, it starts with a precise confirmation that a leak actually exists: open the Chrome Task Manager, repeat the suspicious action twenty to thirty times, and watch whether the value in the JavaScript Memory column settles at a higher level than before after each repetition. If the baseline keeps climbing instead of returning to the starting level after a garbage collection cycle, the leak is confirmed and reproducible, the basic precondition for any further analysis with heap snapshots and retainer paths.
Before every snapshot it's worth manually clicking the trash can icon in the Memory panel, which forces a garbage collection and prevents normal, temporarily alive objects from being misread as a leak. After implementing a fix, the same workflow is run again to confirm the baseline now stays stable. The table below summarizes the most common leak patterns with their symptom and recommended fix.
| Leak type | Symptom | Cause | Recommended fix |
|---|---|---|---|
| Detached DOM nodes | Heap grows with every navigation | Reference in array/cache survives DOM removal | Clear references in a cleanup handler |
| Event listeners | Handler fires repeatedly, duplicate events | addEventListener without removeEventListener | AbortController with a shared signal |
| Closures | Large object stays referenced permanently | Closure captures the whole scope instead of one variable | Destructure only the values needed |
| Global variables/caches | Memory usage grows linearly over time | Unbounded cache in module or window scope | WeakMap plus a cache upper bound |
| Alpine.js components | Timers/watchers keep running after removal | No teardown logic on x-data destruction | Cleanup via the $cleanup hook |
In practice several of these patterns show up together: a forgotten event listener often keeps an entire detached DOM node alive too, because both are tied together through the same closure. Consistently avoiding the patterns from the table and applying the debugging workflow the moment a leak is suspected prevents small leaks from adding up to noticeable performance problems over the course of hours.
Mironsoft
Performance debugging, memory profiling, and Hyvä optimization for Magento stores
Ready to find and fix your memory leaks?
We analyze your store's JavaScript heap, identify detached DOM nodes, forgotten event listeners, and closure leaks, and implement targeted fixes, from Alpine.js components to caching strategy.
Memory audit
Heap snapshot analysis, retainer paths, and a leak list prioritized by business impact
Alpine.js optimization
Teardown hooks, event listener cleanup, and timer management in Hyvä components
Monitoring setup
Continuous memory tracking and regression alerts in the CI/CD pipeline
10. Summary
Memory leaks in JavaScript almost always come from the same root pattern: an object stays reachable through a forgotten reference chain even though the application no longer needs it. Detached DOM nodes, event listeners that were never removed, overly broad closures, and unbounded growing global caches together account for the vast majority of leaks in production frontend code. Heap snapshots and the allocation instrumentation timeline in Chrome DevTools reliably identify these patterns, right down to the exact line of code via the retainer path.
It's especially important to recognize that SPA style applications and long lived Alpine.js components are structurally more exposed than classic, server rendered Magento navigation, because there's no automatic heap reset on every page navigation. Consistently cleaning up timers, event listeners, and subscriptions through cleanup hooks like $cleanup or AbortController, and applying the reproducible debugging workflow at the first sign of trouble, prevents small leaks from adding up to a crashing tab over a long session.
Memory Leaks in JavaScript, The Essentials at a Glance
Most common leak sources
Detached DOM nodes, forgotten event listeners, overly broad closures, and unbounded global caches.
Comparing heap snapshots
Capture state before and after the suspicious action, sort by #Delta, check the retainer path.
Allocation timeline
Shows allocations in real time, bars staying blue mark objects that were never released.
SPA and Alpine.js
Long lived components need explicit cleanup hooks, classic Magento navigation resets the heap automatically.