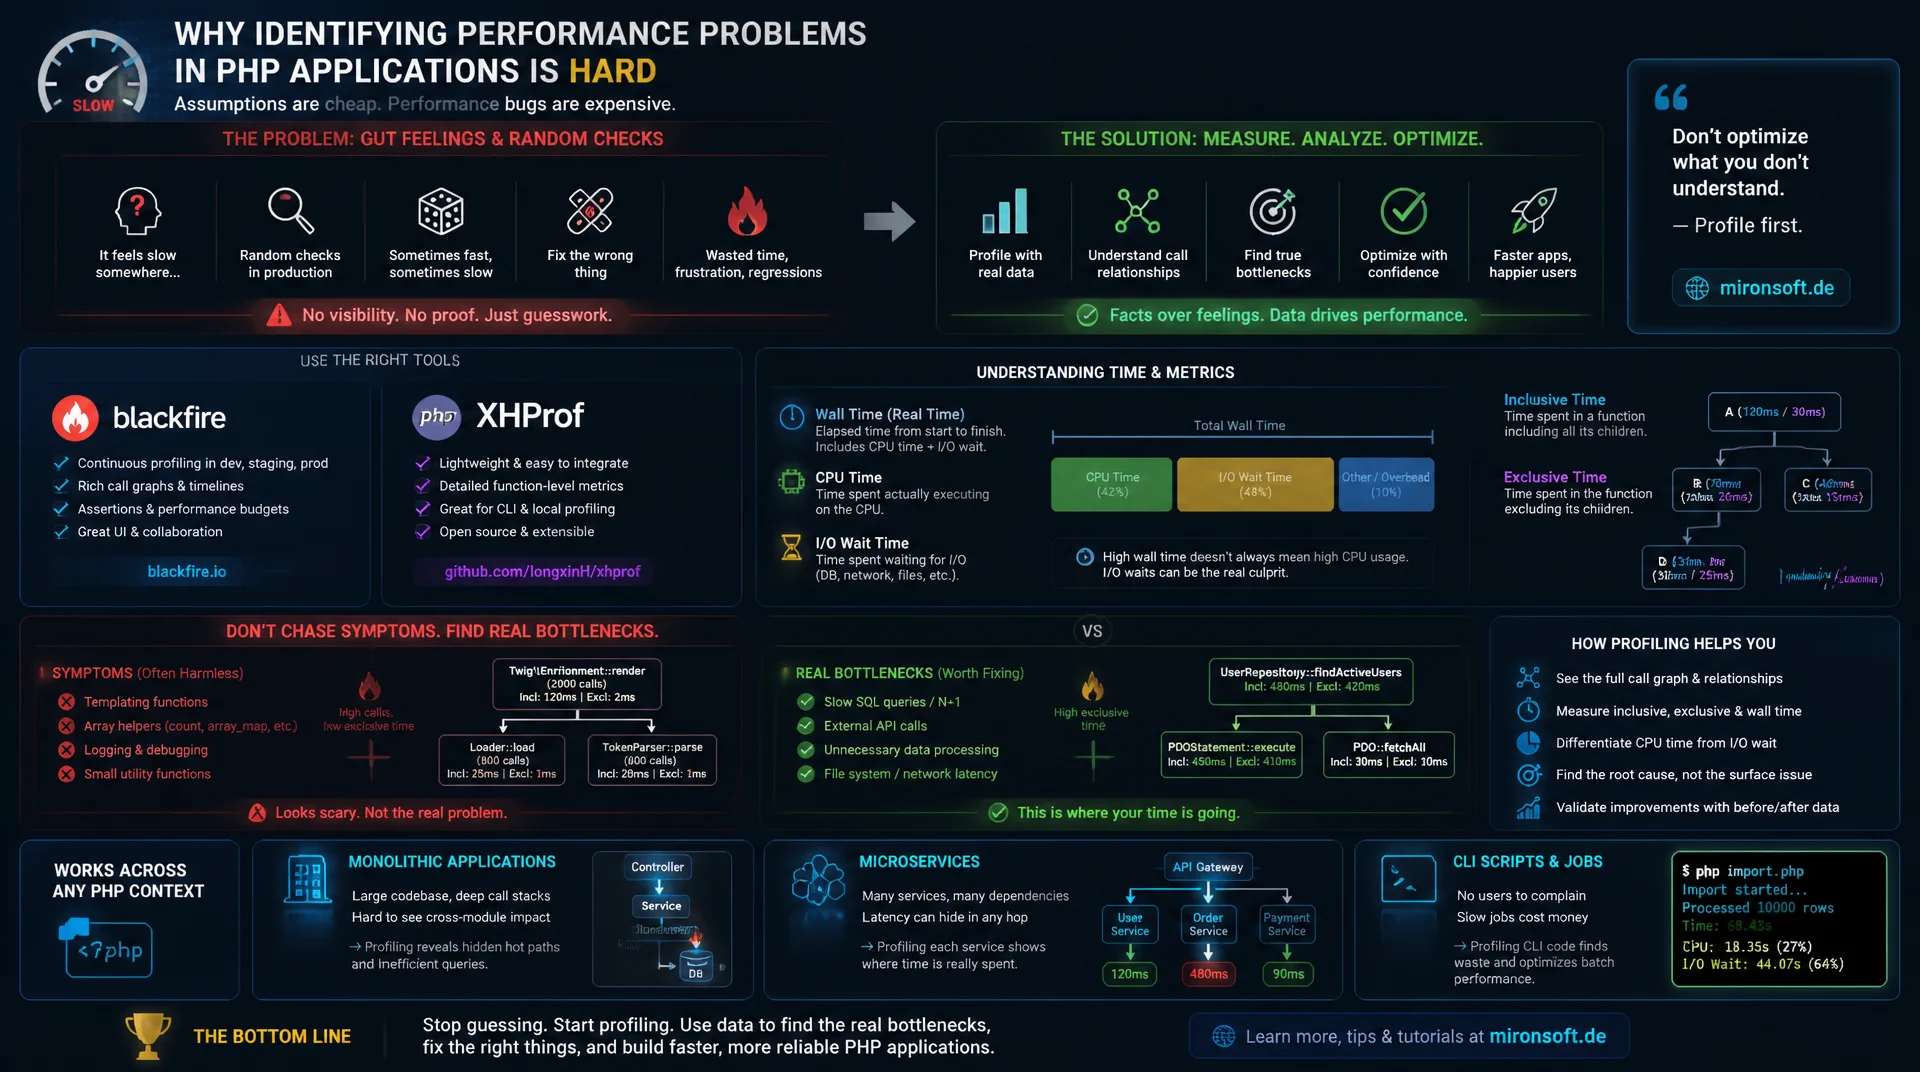
Systematically finding bottlenecks before they become a production problem
Anyone who hunts performance problems in PHP applications only through gut feeling and spot-checks in production wastes time on the wrong places. Blackfire and XHProf deliver reliable callgraphs, separate exclusive and inclusive times, as well as standalone wall time, CPU time, and I/O wait metrics, letting you clearly distinguish real bottlenecks from harmless symptoms, whether in a monolith, a microservice, or a CLI script.
Table of Contents
- 1. Why Performance Profiling Is Necessary
- 2. XHProf Basics: Extension, API, and Raw Data
- 3. Blackfire Basics: Probe, Agent, and SaaS Backend
- 4. Callgraph Analysis: Exclusive Time vs. Inclusive Time
- 5. Interpreting Wall Time, CPU Time, and I/O Wait
- 6. Blackfire CLI and Automated Assertions
- 7. Setting Up XHProf Standalone and Diffing Runs
- 8. Reading and Generating Flame Graphs
- 9. Practical Comparison: When Blackfire, When XHProf
- 10. Summary
- 11. FAQ
1. Why Performance Profiling Is Necessary
Performance profiling is the systematic attempt to find out where the runtime of a PHP application actually goes, instead of guessing based on assumptions. Without measurement, optimization attempts almost always land in the wrong place: a developer optimizes a function that in practice accounts for only a fraction of the total time, while the actual bottleneck remains untouched. Only reliable performance profiling shows which function calls consume how much time, CPU load, or memory, turning optimization into a data-driven exercise instead of an intuitive one.
Fundamentally, there are two approaches to performance profiling. Sampling profilers take a snapshot of the current call stack at fixed intervals, for example every millisecond. From many such samples it emerges statistically which functions frequently sit on the stack and therefore presumably consume a lot of time. The overhead is low because no instrumentation is active between samples, but the result remains an approximation: very short function calls can vanish entirely between two samples.
Instrumentation profilers such as XHProf and Blackfire's probe take the opposite approach: every single function call is measured on entry and exit, producing exact call counts, times, and in some cases memory usage per function. The price for this is noticeable overhead, which can multiply the runtime during profiling many times over. This is why performance profiling with these tools is typically enabled specifically for individual requests or script runs rather than running continuously in production.
2. XHProf Basics: Extension, API, and Raw Data
XHProf is a PHP extension, originally released by Facebook and today available for current PHP versions in actively maintained forks such as longxinh/xhprof. Installation happens via PECL or by manually compiling against the existing PHP version, after which the extension is enabled via extension=xhprof.so in php.ini. Since XHProf hooks directly into the Zend Engine, the extension must match the exact PHP minor version, a point that occasionally requires a current fork instead of the original repository for PHP 8.4 environments.
The API is deliberately minimal: xhprof_enable() starts instrumentation for the current request or script run, optionally with flags such as XHPROF_FLAGS_CPU for CPU time capture and XHPROF_FLAGS_MEMORY for memory usage. xhprof_disable() ends the measurement and returns an associative array in which, for every observed function, the number of calls as well as wall time, CPU time, and memory values are stored, each broken down by caller context.
This raw data is initially just a PHP array in memory and must be persisted yourself, for instance as a serialized file or as a record in your own database, each under a unique run ID. Only then can it be loaded into an interface such as the classic tprofiler UI or a more modern fork like XHGui to interactively examine callgraphs, call counts, and times.
<?php

declare(strict_types=1);

// Enable instrumentation profiling with CPU and memory tracking.
// XHPROF_FLAGS_CPU and XHPROF_FLAGS_MEMORY add overhead but
// are required to interpret CPU time separately from wall time.
xhprof_enable(XHPROF_FLAGS_CPU | XHPROF_FLAGS_MEMORY);

// --- application code under test runs here ---
runOrderImportBatch();
// -----------------------------------------------

// Stop instrumentation and retrieve the raw call data as an array.
$rawData = xhprof_disable();

// Persist the raw data to disk with a unique run id so it can be
// loaded later by a UI (tprofiler, XHGui) or diffed against another run.
$runId = uniqid('', true);
$namespace = 'order_import';
$storageDir = '/var/xhprof-runs';

if (!is_dir($storageDir)) {
    mkdir($storageDir, 0755, true);
}

file_put_contents(
    sprintf('%s/%s.%s.xhprof', $storageDir, $runId, $namespace),
    serialize($rawData)
);

echo "Profiling run stored as {$runId}\n";
3. Blackfire Basics: Probe, Agent, and SaaS Backend
Blackfire consists of three clearly separated components. The probe is a PHP extension that, similar to XHProf, hooks into the Zend Engine and collects raw data for every function call. The agent is a local daemon process on the same host or container that receives the raw data from the probe over a Unix socket, buffers it, and forwards it. The SaaS backend, optionally also available as a self-hosted enterprise variant, handles the actual evaluation: it builds the callgraph from the raw data, computes metrics, and renders the interactive interface.
A typical profiling request works like this: the developer triggers the measurement, via a browser toolbar, the blackfire curl command, or a set X-Blackfire-Query header. The probe recognizes the trigger, activates instrumentation for exactly that request, and sends the collected raw data to the local agent after completion. The agent uploads the data to the Blackfire backend, which generates a finished, shareable profiling report from it within a few seconds.
Unlike XHProf, this flow eliminates any manual storage and any custom interface. Blackfire additionally profiles not only HTTP requests but equally CLI scripts, worker, and queue processes, making performance profiling of background jobs just as easy as that of a single web page.
4. Callgraph Analysis: Exclusive Time vs. Inclusive Time
The callgraph is the central tool of any deeper performance analysis, and its usefulness stands or falls with the distinction between exclusive time and inclusive time. Exclusive time, also called self time, measures exclusively the time spent within a function's own body, without the time of its sub-functions. Inclusive time, on the other hand, sums the entire time from entry to exit of the function, including all calls beneath it.
This distinction determines where a real bottleneck lies. Sorting by exclusive time finds the functions that actually compute themselves, such as serialization, regular expressions, or array operations. Sorting instead by inclusive time finds expensive subtrees in the call, i.e. functions that barely spend time themselves but call expensive functions beneath them. A function with high inclusive time and low exclusive time is a pure pass-through, the bottleneck lies further down in the tree.
In practice this shows up, for instance, in a repository method whose exclusive time is close to zero, but whose inclusive time accounts for ninety percent of a request's total time. Optimizing this method itself achieves nothing; the callgraph must be expanded further until the actual database query or the expensive serializer becomes visible. Without the separate consideration of exclusive and inclusive time, any performance profiling remains superficial.
5. Interpreting Wall Time, CPU Time, and I/O Wait
Besides the callgraph, good performance profiling delivers three separate time metrics: wall time, CPU time, and the I/O wait time derivable from them. Wall time is the actual elapsed clock time from start to end of a call. CPU time is the time the processor actually spent computing for this call during that period. The difference between the two values is the wait time during which the process was blocked without computing itself.
A function with high wall time but low CPU time is waiting, it isn't computing. That points to network latency, a slow database query, blocking file I/O, or lock contention, not to an inefficient algorithm. The right lever here is not code optimization but reducing round trips, caching, or parallelization. Conversely, a function with high CPU time shows genuine computational effort, which only decreases through a better algorithm or less work per call.
XHProf delivers wall time by default, CPU time only with the XHPROF_FLAGS_CPU flag set, because capturing it causes additional overhead. Blackfire automatically separates both values in its timeline view and explicitly marks wait time as its own bar, which allows interpretation without manual calculation and considerably speeds up performance profiling.
6. Blackfire CLI and Automated Assertions
The Blackfire CLI makes performance profiling scriptable and thus automatable. Commands such as blackfire run php script.php or blackfire curl url trigger a profiling run without browser interaction, directly from a terminal or a build pipeline. This allows a critical path of an application to be profiled automatically on every build, instead of checking performance only occasionally by hand.
The real strength shows up in the .blackfire.yml file, where scenarios and assertions are defined. An assertion such as main.wall_time < 200ms or main.peak_memory < 64mb automatically checks after every profiling run whether a defined threshold has been exceeded. blackfire run returns a non-zero exit code when an assertion is violated, allowing performance regressions to be blocked directly in the CI pipeline before they reach the main branch.
In practice, a reference workflow establishes itself: a baseline run on the main branch delivers the comparison values, every further run on a feature branch is automatically compared against this reference. Blackfire then flags exactly the functions that have become slower compared to the reference, making performance regressions visible at the function level, not just as a vague overall time deviation.
# Trigger a profiling run against the local dev environment,
# without opening a browser, directly from the CI job.
blackfire run --samples=1 php artisan orders:import --file=sample.csv

# Profile a single HTTP endpoint through curl instead of a real client.
blackfire curl https://staging.example.com/api/orders

# Exit code is non-zero if any assertion in .blackfire.yml fails,
# so this line alone can gate a merge in a CI pipeline.
echo "Blackfire exit code: $?"
# .blackfire.yml
# Defines automated performance assertions checked after every run.
tests:
  "Order import stays within performance budget":
    path: "/api/orders/import"
    assertions:
      - "main.wall_time < 250ms"
      - "main.cpu_time < 180ms"
      - "main.peak_memory < 96mb"
      - "sql.queries.count < 15"

  "No N+1 query pattern on product listing":
    path: "/catalog/products"
    assertions:
      - "metrics.sql.queries.count < 10"
      - "main.wall_time < 150ms"
7. Setting Up XHProf Standalone and Diffing Runs
Since XHProf doesn't come with built-in persistence, a storage layer of your own must be added to make performance profiling evaluable over time. Classically, this is implemented as a simple storage interface that serializes the raw data delivered by xhprof_disable() and stores it under a unique combination of run ID, namespace, and timestamp, either in the filesystem or in a custom database table.
The actual added value comes from diffing two runs: you load the raw data of two profiling runs, for instance before and after a deployment, and compare, for every function present in both runs, the difference in wall time and exclusive time. Sorting the result in descending order by the difference brings the functions that became the most noticeably slower between the two runs to the top, the manual equivalent of Blackfire's automatic reference comparison.
In practice, hardly anyone still uses the original tprofiler UI anymore, because its old code no longer runs on current PHP versions. Established forks such as XHGui instead bring modern, database-backed storage and a web interface with built-in diff functionality, noticeably reducing the manual effort for performance profiling with XHProf.
<?php

declare(strict_types=1);

/**
 * Load two persisted XHProf raw data arrays and diff them by
 * wall time and exclusive time, to spot regressions manually
 * without a dedicated UI.
 */
function loadRun(string $path): array
{
    return unserialize(file_get_contents($path), ['allowed_classes' => false]);
}

$before = loadRun('/var/xhprof-runs/before-deploy.order_import.xhprof');
$after  = loadRun('/var/xhprof-runs/after-deploy.order_import.xhprof');

$diffs = [];

foreach ($after as $function => $metrics) {
    if (!isset($before[$function])) {
        continue; // function did not exist in the baseline run
    }

    $wallDelta = $metrics['wt'] - $before[$function]['wt'];
    $exclDelta = ($metrics['wt'] - ($metrics['ct'] ?? 0))
        - ($before[$function]['wt'] - ($before[$function]['ct'] ?? 0));

    $diffs[$function] = [
        'wall_delta_us' => $wallDelta,
        'exclusive_delta_us' => $exclDelta,
    ];
}

// Sort by wall time delta descending: biggest regressions first.
uasort($diffs, static fn (array $a, array $b): int => $b['wall_delta_us'] <=> $a['wall_delta_us']);

foreach (array_slice($diffs, 0, 10, true) as $function => $delta) {
    printf("%-40s %+8d us wall  %+8d us exclusive\n", $function, $delta['wall_delta_us'], $delta['exclusive_delta_us']);
}
8. Reading and Generating Flame Graphs
A flame graph makes a callgraph readable at a glance, without having to search through tables of numbers. The X axis doesn't represent chronological order but the frequency, or rather the time share, of a call path, the Y axis represents the depth of the call stack. The width of each box is proportional to the time consumed, so the widest boxes immediately stand out as the biggest time sinks.
XHProf doesn't deliver directly flame-graph-compatible data; the raw data must first be converted into the folded stack format expected by Brendan Gregg's flamegraph.pl: one line per call path with semicolon-separated function names and the associated time. Ready-made conversion scripts exist for this, translating the nested XHProf callgraphs into this flat format. Blackfire instead renders an interactive callgraph and a timeline view, presenting the same information differently but also visually.
When reading a flame graph, width matters most, not height: a wide plateau near the top shows a leaf function with high exclusive time, i.e. a real bottleneck that should be tackled first in performance profiling. A tall but narrow tower, on the other hand, shows deep but overall cheap recursion, which is rarely the actual performance killer.
# Convert a persisted XHProf run into the folded-stack format that
# Brendan Gregg's FlameGraph toolkit expects, then render an SVG.

php convert-xhprof-to-folded.php /var/xhprof-runs/run.order_import.xhprof \
  > /tmp/order_import.folded

# stackcollapse step is already done by the converter above,
# flamegraph.pl only needs the folded format as input.
flamegraph.pl /tmp/order_import.folded > /tmp/order_import.svg

echo "Flame graph written to /tmp/order_import.svg"
9. Practical Comparison: When Blackfire, When XHProf
Blackfire plays out its strengths wherever performance profiling becomes a team task. Shared profiles with comments, automated assertions in the CI pipeline, and the ability to profile not just HTTP requests but also CLI scripts and worker processes without extra effort speak for the managed-service approach, though against ongoing license costs and a dependency on an external provider.
XHProf scores where full control and no external dependencies matter more than convenience. It's open source, free, and all profiling data stays entirely within your own infrastructure, a relevant point for environments with strict compliance requirements. The price for this is your own maintenance effort for storage, interface, and diff tooling, since the tools around XHProf must be maintained yourself.
In practice, the two tools don't rule each other out. XHProf is suited for fast, local performance profiling during development, without any account or network dependency. Blackfire handles team-wide, CI- and staging-integrated, continuous regression detection before every production deployment. Many teams use both in parallel: XHProf for fast iteration on their own machine, Blackfire as an automated gate before the next release.
| Criterion | Blackfire | XHProf |
|---|---|---|
| Architecture | Probe, local agent, SaaS backend (or self-hosted) | PECL extension, custom storage and interface |
| Cost | Commercial, limited free tier, license per team | Open source, free, no license model |
| CI Integration | blackfire run plus .blackfire.yml assertions natively |
Custom diff scripting for manual regression detection |
| Visualization | Interactive callgraph, timeline, and automatic reference comparison | Flame graph after conversion, XHGui web interface |
| Data Ownership | Data leaves your infrastructure (except enterprise variant) | Data stays entirely within your own infrastructure |
In practice, neither criterion alone is decisive. A team with strict compliance requirements and its own ops capacity often tends toward XHProf, a team seeking fast results without maintenance effort of its own tends toward Blackfire. Both tools ultimately measure the same underlying model of call counts, times, and memory; they differ mainly in convenience, degree of automation, and operating model.
10. Summary
Performance profiling is not a tool for exceptional cases but the only reliable method to find bottlenecks in PHP applications based on data rather than guesswork. Sampling profilers deliver quick, overview-style hints with low overhead; instrumentation profilers such as XHProf and Blackfire deliver exact call counts, exclusive and inclusive times, as well as separate wall time and CPU time values, which clearly distinguish computational load from wait time.
Blackfire brings performance profiling as a managed service with agent, SaaS backend, automated assertions, and reference comparisons directly into the CI pipeline. XHProf offers the same depth as an open-source extension without external dependency, but requires its own storage, diff tooling, and possibly flame graph conversion. Which tool gets the nod depends less on technical depth than on team size, compliance requirements, and the desired degree of automation; in many projects, the two complement each other.
Performance Profiling with Blackfire and XHProf, the Essentials at a Glance
Sampling vs. Instrumentation
Sampling profilers measure snapshots with low overhead, instrumentation profilers such as XHProf and Blackfire measure every call exactly, with noticeable overhead during measurement.
Exclusive vs. Inclusive Time
Exclusive time shows a function's pure self time, inclusive time the time including all sub-calls. The bottleneck lies where inclusive time is high but exclusive time is low.
Wall Time, CPU Time, I/O Wait
High wall time with low CPU time means waiting instead of computing. Caching and fewer round trips help more here than code optimization.
Blackfire vs. XHProf
Blackfire for team convenience and automated CI assertions, XHProf for full control without external dependency. Many teams use both in parallel.
11. FAQ: Performance Profiling with Blackfire and XHProf
1Sampling profiler vs. instrumentation profiler?
2Why does XHProf cause so much overhead?
3Exclusive time vs. inclusive time?
4High wall time, low CPU time?
5Persisting XHProf data permanently?
6How do Blackfire assertions work in CI?
7Blackfire for CLI and worker too?
8Generating a flame graph from XHProf data?
9Is XHProf compatible with PHP 8.4?
10Blackfire or XHProf, or both?
Mironsoft
PHP performance profiling, callgraph analysis, and CI performance gates
PHP applications that don't buckle under load?
We set up performance profiling with Blackfire or XHProf in your project, analyze callgraphs for real bottlenecks, and build automated performance assertions into your CI pipeline, so regressions get caught before they go live.
Profiling Setup
Set up Blackfire probe and agent, or XHProf with custom storage, production-ready
Callgraph Analysis
Systematically evaluate exclusive and inclusive time and identify real bottlenecks
CI Performance Gates
Integrate automated assertions and reference comparisons into your build pipeline