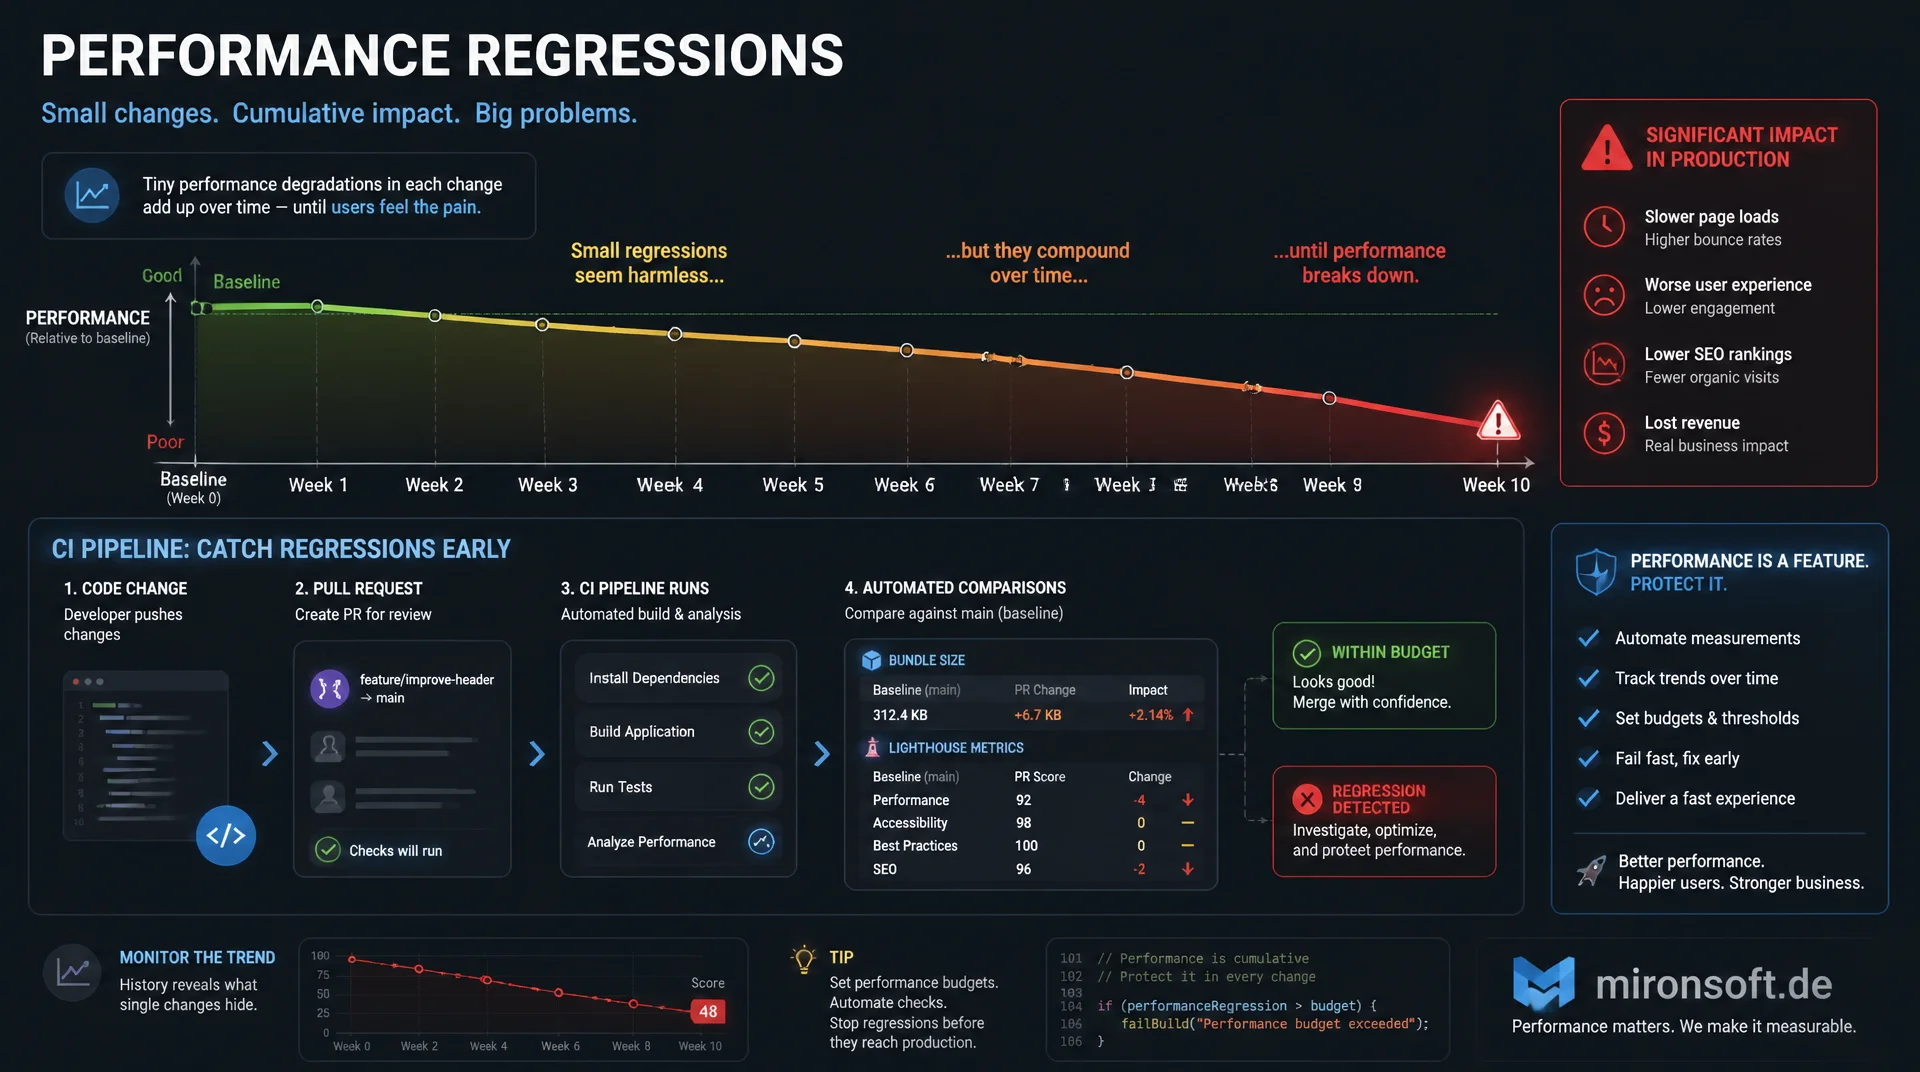
Bundle size diffs and Lighthouse comparisons as a pre-merge gate
Performance regressions rarely come from one dramatic change, they accumulate from many small degradations that each stay under the radar. A CI pipeline that automatically compares bundle size and Lighthouse metrics against the base branch on every pull request makes this slow decline visible before it reaches the main branch and production.
Table of Contents
- 1. Pre-Merge Gate vs. Post-Merge Monitoring
- 2. Anatomy of a Regression Test Pipeline
- 3. Bundle Size Tracking per Pull Request
- 4. Commenting the Diff Automatically on the PR
- 5. Lighthouse Score Diffing Between Branches
- 6. Automatically Flagging Statistically Significant Changes
- 7. Taming Noise in CI Runners
- 8. Balancing CI Runtime Cost Against Thoroughness
- 9. Caching Build Artifacts and Strategies Compared
- 10. Summary
- 11. FAQ
1. Pre-Merge Gate vs. Post-Merge Monitoring
A pre-merge gate checks performance metrics before code lands on the main branch and blocks or flags the pull request when it detects a regression. Post-merge monitoring, via real user monitoring or synthetic checks against production, only catches regressions once they are already live. The two approaches are not mutually exclusive, they solve different problems: post-merge monitoring surfaces effects that only appear under real load, real networks, and real devices. A pre-merge gate prevents obvious regressions from ever reaching that stage in the first place.
The economic difference lies in the cost of fixing the problem. A regression caught in a pull request costs the author a few minutes of rework, while the same bug in production is often only noticed days later through declining conversion numbers or a CrUX drop, and then requires several follow-up commits, a revert, or a hotfix to resolve. For Magento and Hyva shops with frequent deployments, a pre-merge gate is therefore not an add-on but the first line of defense, while post-merge monitoring retains oversight of the actual user experience.
2. Anatomy of a Regression Test Pipeline
A working regression test pipeline needs three building blocks: a reproducible build for the pull request branch, a baseline measurement for the base branch (usually main), and a comparison step that puts both measurements side by side. Ideally the baseline is not re-measured on every PR, but produced once after each merge into main and stored as an artifact or in a small data store. This saves CI time and ensures every pull request is compared against the same stable reference value instead of a freshly measured, potentially noisy one.
The comparison step itself should run as its own job that takes the build and the baseline as input and produces a structured diff as output, for example in JSON format. This separation lets you reuse the same comparison logic for both bundle size and Lighthouse diffs and test it independently of the actual build process. It is also important that the pipeline uses the exact same build process for both the PR branch and the baseline, because different Node or PHP versions, different NODE_ENV values, or diverging Tailwind configuration will skew the comparison regardless of any real code changes.
3. Bundle Size Tracking per Pull Request
Bundle size tracking measures the size of the shipped JavaScript and CSS files after the build and compares them against the same build on the base branch. What matters is comparing not the raw uncompressed size but the size after gzip or brotli compression, because that matches the data volume actually transferred over the network. For Hyva themes this means concretely: web/tailwind/tailwind.css after the purge step and the generated Alpine.js bundles under pub/static/frontend/ are the relevant artifacts, not the unminified source code.
A simple, robust bash pattern checks out both branches in turn, builds them identically, and sums the file sizes per category. The diff is calculated as a percentage relative to the base size, not as an absolute byte difference, because a 5 KB delta on a 20 KB bundle means something entirely different than on a 500 KB bundle. A threshold of, say, 5 percent growth per category allows normal development to proceed while preventing unnoticed bloat from accumulating across many small pull requests.
#!/usr/bin/env bash
# bundle-size-diff.sh - Compare gzip bundle size between two git refs
set -euo pipefail

BASE_REF="${1:-origin/main}"
HEAD_REF="${2:-HEAD}"
THRESHOLD_PERCENT=5
BUNDLE_GLOB="pub/static/frontend/**/*.{js,css}"

measure_bundle_size() {
  local ref="$1"
  local worktree
  worktree="$(mktemp -d)"
  git worktree add --detach "$worktree" "$ref" >/dev/null
  ( cd "$worktree" && npm ci --silent && npm run build --silent )

  # Sum gzip-compressed size of all matching assets in bytes
  find "$worktree/pub/static/frontend" -type f \( -name "*.js" -o -name "*.css" \) \
    -exec gzip -c {} \; | wc -c

  git worktree remove --force "$worktree"
}

base_size="$(measure_bundle_size "$BASE_REF")"
head_size="$(measure_bundle_size "$HEAD_REF")"
delta=$(( head_size - base_size ))
percent=$(awk -v b="$base_size" -v d="$delta" 'BEGIN { printf "%.2f", (d / b) * 100 }')

echo "Base: ${base_size} bytes | Head: ${head_size} bytes | Delta: ${delta} bytes (${percent}%)"

if awk -v p="$percent" -v t="$THRESHOLD_PERCENT" 'BEGIN { exit !(p > t) }'; then
  echo "[FAIL] Bundle grew by ${percent}%, exceeds threshold of ${THRESHOLD_PERCENT}%"
  exit 1
fi
echo "[OK] Bundle size within threshold"
4. Commenting the Diff Automatically on the PR
Few developers go looking for a number buried in a CI log. A far more effective approach is an automatic PR comment that surfaces the bundle size and Lighthouse diff directly where code review already happens. The common technique for this is a sticky comment: instead of creating a new comment on every pipeline run, the bot looks for an existing comment with a unique marker (for example a hidden HTML comment <!-- perf-bot-marker -->) and updates it, rather than flooding the thread with repeated comments.
The comment should not just show the total number but break down where the size change comes from per file or chunk, including a link to the full Lighthouse report as an artifact. For teams running multiple storefronts or brands, a table per page type (home, category, product) is worth the extra effort, because a regression often affects only a single page template and an aggregated total number would hide that. Additionally setting a status: failure on the corresponding GitHub check makes the result usable by branch protection rules, not just visible in the comment.
# .github/workflows/performance-regression.yml
name: Performance Regression Check
on:
  pull_request:
    branches: [main]

jobs:
  bundle-and-lighthouse-diff:
    runs-on: ubuntu-latest
    steps:
      - uses: actions/checkout@v4
        with:
          fetch-depth: 0

      - uses: actions/setup-node@v4
        with:
          node-version: 20
          cache: npm

      # Restore cached base-branch build to avoid rebuilding main every run
      - name: Restore baseline artifact
        uses: actions/cache/restore@v4
        with:
          path: .baseline
          key: baseline-${{ github.event.pull_request.base.sha }}

      - name: Build PR branch
        run: npm ci && npm run build

      - name: Compare bundle size
        id: bundle
        run: bash ./ci/bundle-size-diff.sh origin/${{ github.base_ref }} HEAD >> "$GITHUB_OUTPUT"

      - name: Run Lighthouse CI on both branches
        run: npx @lhci/cli autorun --config=./lighthouserc.json

      - name: Post or update sticky PR comment
        uses: marocchino/sticky-pull-request-comment@v2
        with:
          header: perf-bot-marker
          message: |
            ## Performance Regression Report
            ${{ steps.bundle.outputs.summary }}
5. Lighthouse Score Diffing Between Branches
Lighthouse score diffing goes a step beyond plain bundle tracking, because a smaller JavaScript file does not automatically mean a faster page. The pipeline builds both branches, deploys them to identically configured, temporary environments (for example Docker containers with the same seed dataset), and runs Lighthouse CI against the same URLs on both environments. What gets compared is not just the performance score but the individual metrics LCP, TBT (Total Blocking Time as a lab approximation of INP), and CLS, because a regression often affects only a single metric while the aggregated score masks it through improvements elsewhere.
An identical test environment for both runs is critical for reliable results: same CPU throttling, same network simulation, same number of repetitions. Lighthouse CI supports this through numberOfRuns in its config, running multiple passes per URL and using the median instead of a single value. For Magento shops with product pages that load varying numbers of images and variants depending on category, several representative page types should be tested, not just the homepage, since that is often the fastest and least representative page in the whole shop.
{
  "ci": {
    "collect": {
      "url": [
        "http://localhost:3000/",
        "http://localhost:3000/catalog/womens-jackets.html",
        "http://localhost:3000/catalog/product/view/id/1284"
      ],
      "numberOfRuns": 5,
      "settings": {
        "throttlingMethod": "simulate",
        "throttling": {
          "cpuSlowdownMultiplier": 4,
          "rttMs": 150,
          "throughputKbps": 1600
        }
      }
    },
    "assert": {
      "assertions": {
        "categories:performance": ["error", { "minScore": 0.85 }],
        "largest-contentful-paint": ["error", { "maxNumericValue": 2500 }],
        "total-blocking-time": ["error", { "maxNumericValue": 300 }],
        "cumulative-layout-shift": ["error", { "maxNumericValue": 0.1 }]
      }
    },
    "upload": {
      "target": "temporary-public-storage"
    }
  }
}
6. Automatically Flagging Statistically Significant Changes
A naive number comparison between two Lighthouse runs produces useless results, because a single run already swings by several hundred milliseconds without any code change at all. The fix is to compare a distribution of several runs per branch rather than a single value, and only report a regression once the difference between the medians crosses a defined tolerance threshold, usually combining a relative percentage (for example a 10 percent LCP degradation) with an absolute minimum (for example at least 150 milliseconds), so that tiny percentage jumps on already very fast metrics do not falsely count as regressions.
A Node script that reads in two sets of Lighthouse JSON reports is a good place to implement this logic once and apply it consistently across metrics, instead of duplicating it in every workflow. It matters that the script allows different thresholds per metric, because CLS naturally fluctuates in a much smaller value range than LCP and therefore needs a different relative threshold. The result should be returned as structured JSON so it can feed both the PR comment and the pipeline's exit code.
// compare-lighthouse-reports.js - Flag statistically significant regressions
const fs = require('node:fs');

const METRIC_THRESHOLDS = {
  'largest-contentful-paint': { relativePercent: 10, absoluteMinMs: 150 },
  'total-blocking-time': { relativePercent: 15, absoluteMinMs: 50 },
  'cumulative-layout-shift': { relativePercent: 15, absoluteMinMs: 0.01 },
};

function median(values) {
  const sorted = [...values].sort((a, b) => a - b);
  const mid = Math.floor(sorted.length / 2);
  return sorted.length % 2 === 0 ? (sorted[mid - 1] + sorted[mid]) / 2 : sorted[mid];
}

function loadMedianMetrics(reportPaths) {
  const runs = reportPaths.map((p) => JSON.parse(fs.readFileSync(p, 'utf8')));
  const result = {};
  for (const metric of Object.keys(METRIC_THRESHOLDS)) {
    result[metric] = median(runs.map((r) => r.audits[metric].numericValue));
  }
  return result;
}

function diffMetrics(baseReports, headReports) {
  const base = loadMedianMetrics(baseReports);
  const head = loadMedianMetrics(headReports);
  const regressions = [];

  for (const [metric, { relativePercent, absoluteMinMs }] of Object.entries(METRIC_THRESHOLDS)) {
    const delta = head[metric] - base[metric];
    const percent = (delta / base[metric]) * 100;

    // Flag only if BOTH the relative and absolute thresholds are exceeded
    if (percent > relativePercent && delta > absoluteMinMs) {
      regressions.push({ metric, base: base[metric], head: head[metric], percent: percent.toFixed(1) });
    }
  }
  return regressions;
}

const regressions = diffMetrics(process.argv.slice(2, 6), process.argv.slice(6, 10));
console.log(JSON.stringify({ regressions, hasRegression: regressions.length > 0 }, null, 2));
process.exit(regressions.length > 0 ? 1 : 0);
7. Taming Noise in CI Runners
CI runners on shared cloud infrastructure do not deliver constant compute performance: neighboring containers on the same host, shifting CPU generations, and variable network latency create scatter that is easily mistaken for a real regression in a single measurement. Teams that ignore this variance end up either with constant false positives that train the team to ignore warnings, or they lower the thresholds so far that real regressions slip through too. Either outcome erodes trust in the whole pipeline.
The most effective countermeasure is a combination of multiple repetitions per measurement (five Lighthouse runs instead of one), using the median instead of the mean since it is more robust against individual outliers, and dedicated, identically sized runners for performance-critical jobs instead of whatever instance happens to be cheapest. A warm-up run before the actual measurement also helps: it is not scored, but it neutralizes caching effects at the operating system and Docker level so the first measured run is not systematically slower than the following ones.
8. Balancing CI Runtime Cost Against Thoroughness
A full Lighthouse audit with five repetitions across several page types and both branches quickly costs several minutes of CI time per pull request, which adds up to significant cost and long wait times for an active team merging twenty PRs a day. Not every pull request needs the same level of scrutiny: a plain text change in CMS content or a translation file has no bearing on bundle size or rendering performance and does not need to run the full audit.
A practical approach is path-based filtering: the full regression test runs only when files under web/, Magento_Theme/templates, or JavaScript/CSS source directories have changed. For every other PR, a fast, cheap bundle size check without a full Lighthouse run is sufficient. On top of that, a label-triggered full audit that reviewers manually trigger with a perf-audit label, plus a nightly full run against main, catches drift over time that individual PR diffs might miss because the cumulative change from many small commits stays under the threshold each time.
9. Caching Build Artifacts and Strategies Compared
Caching build artifacts is the second big lever, alongside sampling, for keeping the pipeline fast. The node_modules cache, the Tailwind JIT cache, and above all the already-built baseline branch should be reused between pipeline runs instead of being regenerated on every PR. A cache key that combines the lockfile hash with the base branch commit SHA ensures the cache is invalidated exactly when dependencies or the baseline have actually changed, and not more often than that.
The table below compares common approaches to regression detection in the CI pipeline by detection point and typical weakness.
| Strategy | Detection Point | Typical Weakness | Recommendation |
|---|---|---|---|
| No automated check | Only after deploy | Regression reaches production unnoticed | Introduce an automated pre-merge gate |
| Manual PR review | Before merge, but unreliable | Reviewer misses a few KB of bundle growth | Automated bot comment with the diff |
| Post-merge RUM only | Days to weeks after merge | Users already affected, root cause hard to trace | Pre-merge gate as complement, not replacement |
| Raw comparison of single Lighthouse runs | Before merge, but noisy | Flaky failures from CI runner variance | Median of multiple runs plus tolerance band |
| Combined bundle and Lighthouse gate with sampling | Before merge, targeted and weighted | Requires upfront configuration effort | Path filtering plus nightly full audit against main |
For GitLab CI, the caching configuration looks technically different from GitHub Actions but follows the same principle: cache dependencies and build output under a stable key so repeated pipeline runs do not start from scratch.
# .gitlab-ci.yml - Cache dependencies and build output to keep the pipeline fast
performance-regression:
  stage: test
  image: node:20-alpine
  rules:
    - changes:
        - "src/app/design/frontend/**/web/**/*"
        - "src/app/design/frontend/**/*.phtml"
  cache:
    key:
      files:
        - package-lock.json
    paths:
      - node_modules/
      - .npm/
    policy: pull-push
  variables:
    NPM_CONFIG_CACHE: "$CI_PROJECT_DIR/.npm"
  before_script:
    - npm ci --prefer-offline --cache .npm
  script:
    - npm run build
    - bash ./ci/bundle-size-diff.sh origin/main HEAD
    - npx @lhci/cli autorun --config=./lighthouserc.json
  artifacts:
    when: always
    paths:
      - .lighthouseci/
    expire_in: 14 days
Mironsoft
Performance engineering, CI/CD pipelines, and monitoring for Magento shops
Want to catch performance regressions automatically?
We set up bundle size tracking and Lighthouse diffing as a pre-merge gate in your CI pipeline, including robust thresholds against CI noise and a sampling strategy that keeps your pipeline fast.
CI Pipeline Audit
Analyze the existing pipeline and identify regression detection gaps
Gate Implementation
Set up bundle diffing, Lighthouse CI, and PR comments in production
Cost Optimization
Caching and sampling to keep the pipeline fast and affordable
10. Summary
Performance regression testing in the CI pipeline solves a problem that purely manual code review cannot structurally solve: the sum of many small, individually unremarkable degradations. A pre-merge gate that automatically compares gzip bundle size and core Lighthouse metrics against the base branch makes this decline visible before it reaches production. What matters for team buy-in is that the pipeline does not constantly raise false alarms from CI noise: a median across several runs, combined relative and absolute thresholds, and a sticky PR comment instead of a buried log entry ensure that developers actually trust the warnings and act on them.
Thoroughness and CI runtime are in direct tension, and that tension cannot be resolved by throwing more compute at it alone. Path-based filtering so pure content changes never trigger a full audit, cached baseline builds instead of repeated recomputation, and a nightly full audit as a safety net against cumulative drift keep the pipeline under a minute for most pull requests without losing signal on changes that actually matter.
Performance Regression Testing in the CI Pipeline - Key Takeaways
Pre-Merge Gate
Bundle size and Lighthouse comparison before merge catches regressions before they reach production. Complements, does not replace, post-merge monitoring.
Bundle Size Diff
Compare gzip size per category against the base branch, express the result as a percentage threshold, not an absolute byte difference.
Statistical Significance
Median across multiple numberOfRuns, combined relative and absolute thresholds against CI noise and false positives.
Cost & Caching
Path-based filtering, cached baseline builds, and a nightly full audit keep the pipeline fast and affordable.