Profiling, caching, and async processing in practice
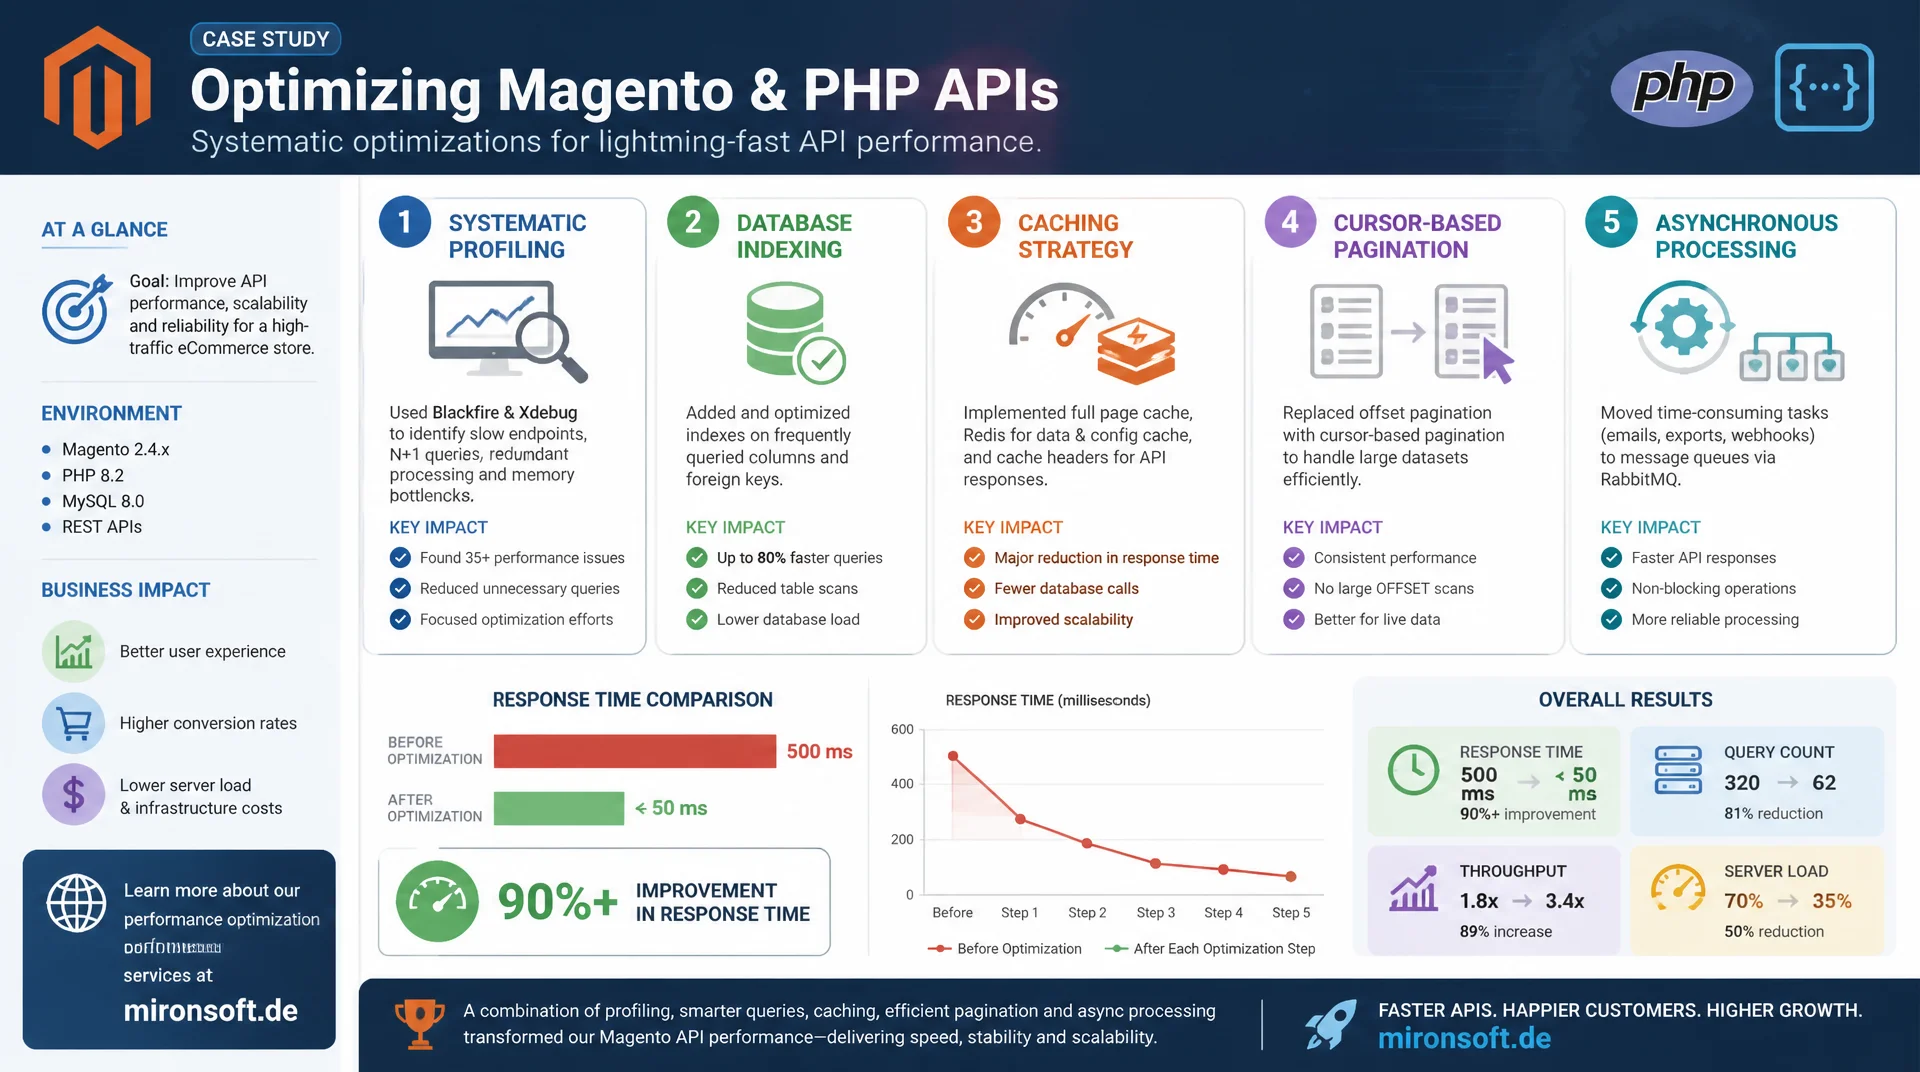
Many Magento and PHP APIs respond in 400 to 800 milliseconds even though the actual work could finish in a few milliseconds. This article walks through a concrete case study showing how systematic profiling, database indexes, caching, cursor based pagination, and asynchronous processing bring response times down from 500 milliseconds to under 50 milliseconds.
Table of Contents
- 1. Why API response time determines UX and infrastructure cost
- 2. Profiling: finding the actual bottleneck
- 3. Database optimization: indexes and fixing N+1 queries
- 4. Response caching: HTTP headers, application cache, and cache keys
- 5. Pagination for large result sets: cursor based vs. offset based
- 6. Async and background processing: queues instead of synchronous waiting
- 7. Serialization and payload reduction
- 8. Case study: from 500ms to 50ms, step by step
- 9. Naive vs. optimized API side by side
- 10. Summary
- 11. FAQ
1. Why API response time determines UX and infrastructure cost
An API response time under 100 milliseconds feels instant to users, past roughly 300 milliseconds every interaction starts to feel sluggish, and past a second, users measurably abandon search suggestions, cart updates, or checkout steps more often. This matters especially in frontends that fire several API calls sequentially or in cascades per page view, where each slow response adds up to an overall sluggish application, even when no single call looks dramatically slow on its own.
Beyond user experience, slow response time carries a direct infrastructure cost: a PHP-FPM worker or database connection occupied for 500 instead of 50 milliseconds can serve ten times fewer requests in the same window. That forces more workers, more autoscaling, and higher hosting costs to absorb the same load. B2B integrations with marketplaces, ERP systems, or payment providers add hard timeout limits on top, which can fail entire order flows when responses take too long.
2. Profiling: finding the actual bottleneck
The most common mistake in performance work is optimizing by guesswork instead of measurement. A 500 millisecond response is almost always composed of several parts: database queries, external API calls such as payment gateways or ERP synchronization, and serialization or JSON encoding of the response. Without profiling, teams usually optimize the wrong end, tuning queries while an external payment call is actually responsible for 300 of the 500 milliseconds.
Tools like Blackfire.io, Xdebug with Cachegrind output, or New Relic APM produce flame graphs that show exactly which function call consumes how much time. In Magento, the built in Magento\Framework\Profiler, enabled via bin/magento dev:profiler:enable, additionally breaks out database, block, and layout timings separately. For production style measurements without noticeable overhead, a simple timing wrapper around the critical phases is often enough.
<?php
declare(strict_types=1);

/**
 * Simple phase-based timer to identify where response time is actually spent.
 * Wrap each logical phase (DB, external call, serialization) individually.
 */
final class ResponseTimeProfiler
{
    /** @var array<string, float> */
    private array $phases = [];

    public function time(string $phaseName, callable $callback): mixed
    {
        $start = hrtime(true);
        $result = $callback();
        $this->phases[$phaseName] = (hrtime(true) - $start) / 1_000_000; // ms

        return $result;
    }

    public function getReport(): array
    {
        return $this->phases;
    }
}

$profiler = new ResponseTimeProfiler();

$orders = $profiler->time('db_query', fn () => $orderRepository->getRecentOrders($customerId));
$enriched = $profiler->time('external_call', fn () => $erpClient->enrichOrders($orders));
$payload = $profiler->time('serialization', fn () => json_encode($enriched, JSON_THROW_ON_ERROR));

// Log once per request, aggregate in APM instead of printing per call
$logger->info('response_time_breakdown', $profiler->getReport());
3. Database optimization: indexes and fixing N+1 queries
The N+1 query problem occurs when a list of records is loaded and each individual record then triggers an additional query inside a loop, for instance to fetch order items per order. With 50 orders, one planned query suddenly turns into 51 separate roundtrips to the database, each carrying its own connection overhead and network latency. This exact pattern creeps into ORM heavy and collection based code paths particularly easily, because loading a single related entity looks syntactically unremarkable.
The second major lever is the index: without a matching index, the database has to run a full table scan on a filtered and sorted query, potentially checking hundreds of thousands of rows before the relevant ones remain. An EXPLAIN immediately reveals whether rows examined sits in the six figure range even though only 50 rows are returned. A composite index on the filter and sort columns often reduces that to a few hundred examined rows.
-- Before: full table scan, 380k rows examined for a 50-row result
SELECT * FROM sales_order
WHERE customer_id = 4821
ORDER BY created_at DESC
LIMIT 50;

-- Add a composite index matching the filter and sort columns exactly
CREATE INDEX idx_customer_created ON sales_order (customer_id, created_at DESC);
-- Query time for this statement alone: 250ms -> 15ms

-- N+1 fix: instead of one query per order inside a PHP loop,
-- load all order items for the page in a single IN() query
SELECT * FROM sales_order_item
WHERE order_id IN (4821, 4822, 4823, 4824, 4825 /* ...50 ids */)
ORDER BY order_id;
-- Collapses 50 roundtrips into 1, saving connection overhead per row
4. Response caching: HTTP headers, application cache, and cache keys
HTTP caching headers such as Cache-Control, ETag, and Last-Modified let a browser, CDN, or reverse proxy skip the backend entirely, or answer with a lean 304 Not Modified instead of recomputing and transferring the full payload. For public, non personalized endpoints this is the most effective lever, because the response time perceived by the client drops to CDN level regardless of how fast the backend itself is.
For personalized but still cacheable responses, an application cache like Redis is needed. The cache key is what matters most here: it must include every parameter that affects the response, meaning customer ID, page, filters, and sort order, otherwise the wrong user or the wrong filter combination ends up served from someone else's cache entry. TTL should follow data volatility, short for frequently changing data such as stock levels, longer with explicit invalidation for stable data such as product descriptions.
GET /api/v2/orders/recent?customer=4821&page=1 HTTP/1.1
If-None-Match: "a1b2c3d4-orders-p1"

# Cache hit, backend not touched for the payload at all
HTTP/1.1 304 Not Modified
ETag: "a1b2c3d4-orders-p1"
Cache-Control: private, max-age=30, stale-while-revalidate=60

# Cache miss, full response with headers for the next request
HTTP/1.1 200 OK
Content-Type: application/json
ETag: "a1b2c3d4-orders-p1"
Cache-Control: private, max-age=30, stale-while-revalidate=60
Vary: Authorization
5. Pagination for large result sets: cursor based vs. offset based
Offset based pagination with OFFSET and LIMIT looks harmlessly fast on the first few pages, but degrades sharply as page depth increases: to serve page 5000 at 20 rows per page, the database first has to read and discard 99,980 rows before the relevant 20 remain. Response time therefore grows linearly with page depth, which turns any API consumer that paginates systematically through a large set into an integration that keeps getting slower.
Cursor based pagination solves this by using an indexed value from the last seen record as a reference point instead of a position, for example WHERE id > :last_id LIMIT 20. Since this query jumps straight through the index, response time stays constant regardless of page depth. The trade off: jumping directly to an arbitrary page number is no longer possible, which requires a stable, unique sort key such as an auto increment ID or a timestamp with a tie breaker.
<?php
declare(strict_types=1);

/**
 * Cursor-based pagination: constant query time regardless of page depth,
 * because the WHERE clause hits the index directly instead of scanning offsets.
 */
final class CursorPaginator
{
    public function __construct(
        private readonly \PDO $connection,
        private readonly int $pageSize = 20,
    ) {
    }

    public function fetchPage(int $customerId, ?int $lastSeenId): array
    {
        $sql = 'SELECT * FROM sales_order
                WHERE customer_id = :customer_id AND id > :cursor
                ORDER BY id ASC
                LIMIT :limit';

        $stmt = $this->connection->prepare($sql);
        $stmt->bindValue(':customer_id', $customerId, \PDO::PARAM_INT);
        $stmt->bindValue(':cursor', $lastSeenId ?? 0, \PDO::PARAM_INT);
        $stmt->bindValue(':limit', $this->pageSize, \PDO::PARAM_INT);
        $stmt->execute();

        return $stmt->fetchAll(\PDO::FETCH_ASSOC);
    }
}
6. Async and background processing: queues instead of synchronous waiting
Not every action needs to finish before an API responds. Sending a confirmation email, ERP synchronization, image processing, or delivering a webhook to a third party are examples of work the client does not need to see in real time. If that kind of work runs synchronously inside the request handler, the client waits for the slowest component involved, even when the resource it actually asked for has long been ready.
The correct pattern: validate the request, enqueue a job into a message queue, and respond immediately with 202 Accepted, while a separate worker process handles the job asynchronously. Magento's MessageQueue framework with RabbitMQ as the broker supports this pattern natively. What matters is idempotency, so a redelivered job doesn't cause duplicate side effects, and a dead letter queue for jobs that keep failing instead of silently losing them.
<?php
declare(strict_types=1);

/**
 * Accept the request, enqueue the slow work, and respond immediately
 * instead of making the client wait for ERP sync and webhook delivery.
 */
final class OrderSyncController
{
    public function __construct(
        private readonly \Magento\Framework\MessageQueue\PublisherInterface $publisher,
    ) {
    }

    public function execute(int $orderId): array
    {
        // Enqueue instead of calling the ERP client synchronously
        $this->publisher->publish('order.erp.sync', (string) $orderId);

        // Respond immediately, worker handles the slow part in the background
        return ['status' => 'accepted', 'order_id' => $orderId];
    }
}
7. Serialization and payload reduction
Serializing a full entity graph with every loaded relation into JSON is more compute intensive than it looks, particularly when reflection based generic serializers are used instead of explicit data transfer objects. Every extra nested object the client never asked for costs server CPU time and network transfer time without delivering any value.
A lean DTO that only contains the fields actually needed significantly reduces both serialization time and payload size. Sparse fieldsets, where the client explicitly names the desired fields, amplify that effect further. Combined with gzip or brotli compression at the reverse proxy level, network transfer time often drops by more than 80 percent compared to an uncompressed, full JSON dump.
This reduction matters disproportionately on mobile clients with variable bandwidth, where transfer time makes up a much larger share of the perceived total response time than in a backend to backend scenario with a stable connection.
8. Case study: from 500ms to 50ms, step by step
The starting point was an order history endpoint for a customer dashboard, returning the last 50 orders with line items, averaging 500 milliseconds. Profiling revealed three dominant contributors: an unindexed filter column, an N+1 loop for order items, and a full entity dump with no field filtering.
Step 1, the composite index on customer_id and created_at, brought the time down from 500 to 310 milliseconds, because the main query switched from a full table scan to an index lookup. Step 2, collapsing the 50 individual order item queries into a single IN() query, cut it further to 140 milliseconds. Step 3, a Redis cache-aside with a 30 second TTL and a cache key built from customer ID, page, and filter hash, brought warm requests down to 45 milliseconds, while cold requests still landed around 140 milliseconds.
Step 4, a lean DTO without unnecessary relations plus gzip compression at the reverse proxy, noticeably reduced the remaining serialization and transfer time. In steady state, the median now sits around 50 milliseconds, with a p95 of roughly 90 milliseconds for the rarer cache miss cases, a tenfold improvement over the starting point.
9. Naive vs. optimized API side by side
The table below summarizes the five most important levers from this case study and shows the typical effect each individual optimization has on response time.
| Aspect | Naive approach | Optimized approach | Effect |
|---|---|---|---|
| Query pattern | N+1 queries, 50 individual SELECTs | 1 IN() query instead of a loop | 180ms to 12ms |
| Pagination | OFFSET 50000 LIMIT 20 | Cursor with indexed WHERE id > ? | 90ms to 4ms |
| Caching | No cache, every request hits the DB | Redis cache-aside, 30s TTL | 120ms to 2ms on cache hit |
| Serialization | Full entity object incl. relations | Lean DTO with field filtering | 35ms to 6ms |
| Response size | 480 KB uncompressed JSON | 38 KB gzip with field filter | Network time minus 85% |
In practice, these five levers rarely act in isolation: a missing index amplifies the cost of N+1 queries, and a large, unfiltered payload keeps hurting on every single request when caching is missing. Applying all five consistently typically yields an improvement of 5x to 10x, as the case study above shows.
Mironsoft
API performance engineering for Magento and PHP backends
Ready to cut your API response times?
We profile your endpoints, find the actual bottleneck between database, external services, and serialization, and implement caching, pagination, and async processing where they count.
API performance audit
Profiling, query analysis, and prioritization by business impact
Caching strategy
HTTP headers, Redis cache keys, and TTL design for stable response times
Async processing setup
Message queues, webhooks, and worker architecture for non-blocking APIs
10. Summary
Optimizing API response times starts with measuring instead of guessing: without profiling, teams optimize the wrong part while the actual bottleneck in database queries, external calls, or serialization stays hidden. Once the real contributor is identified, the classic levers apply: indexes against full table scans, resolving N+1 queries into single batch queries, response caching via HTTP headers and Redis with clean cache keys, cursor based pagination against degrading offset queries, and asynchronous processing for anything the client doesn't need to see in real time.
The case study shows that the path from 500 to 50 milliseconds rarely comes from a single big change, but from four or five targeted steps that reinforce each other. Working through these steps systematically and monitoring p50, p95, and p99 instead of just averages catches regressions early and keeps response time stable even under growing load.
Optimizing API Response Times, the Essentials at a Glance
Profile first
Measure with Blackfire, Xdebug, or the Magento profiler which part, DB, external calls, or serialization, actually dominates.
Indexes and N+1
Composite indexes on filter and sort columns, collapse loop queries into a single batch query with IN().
Caching with clean keys
HTTP headers for browser/CDN, Redis cache-aside for personalized responses, TTL matched to data volatility.
Pagination & async
Cursor instead of offset for deep pages, message queues instead of synchronous waits on slow external services.