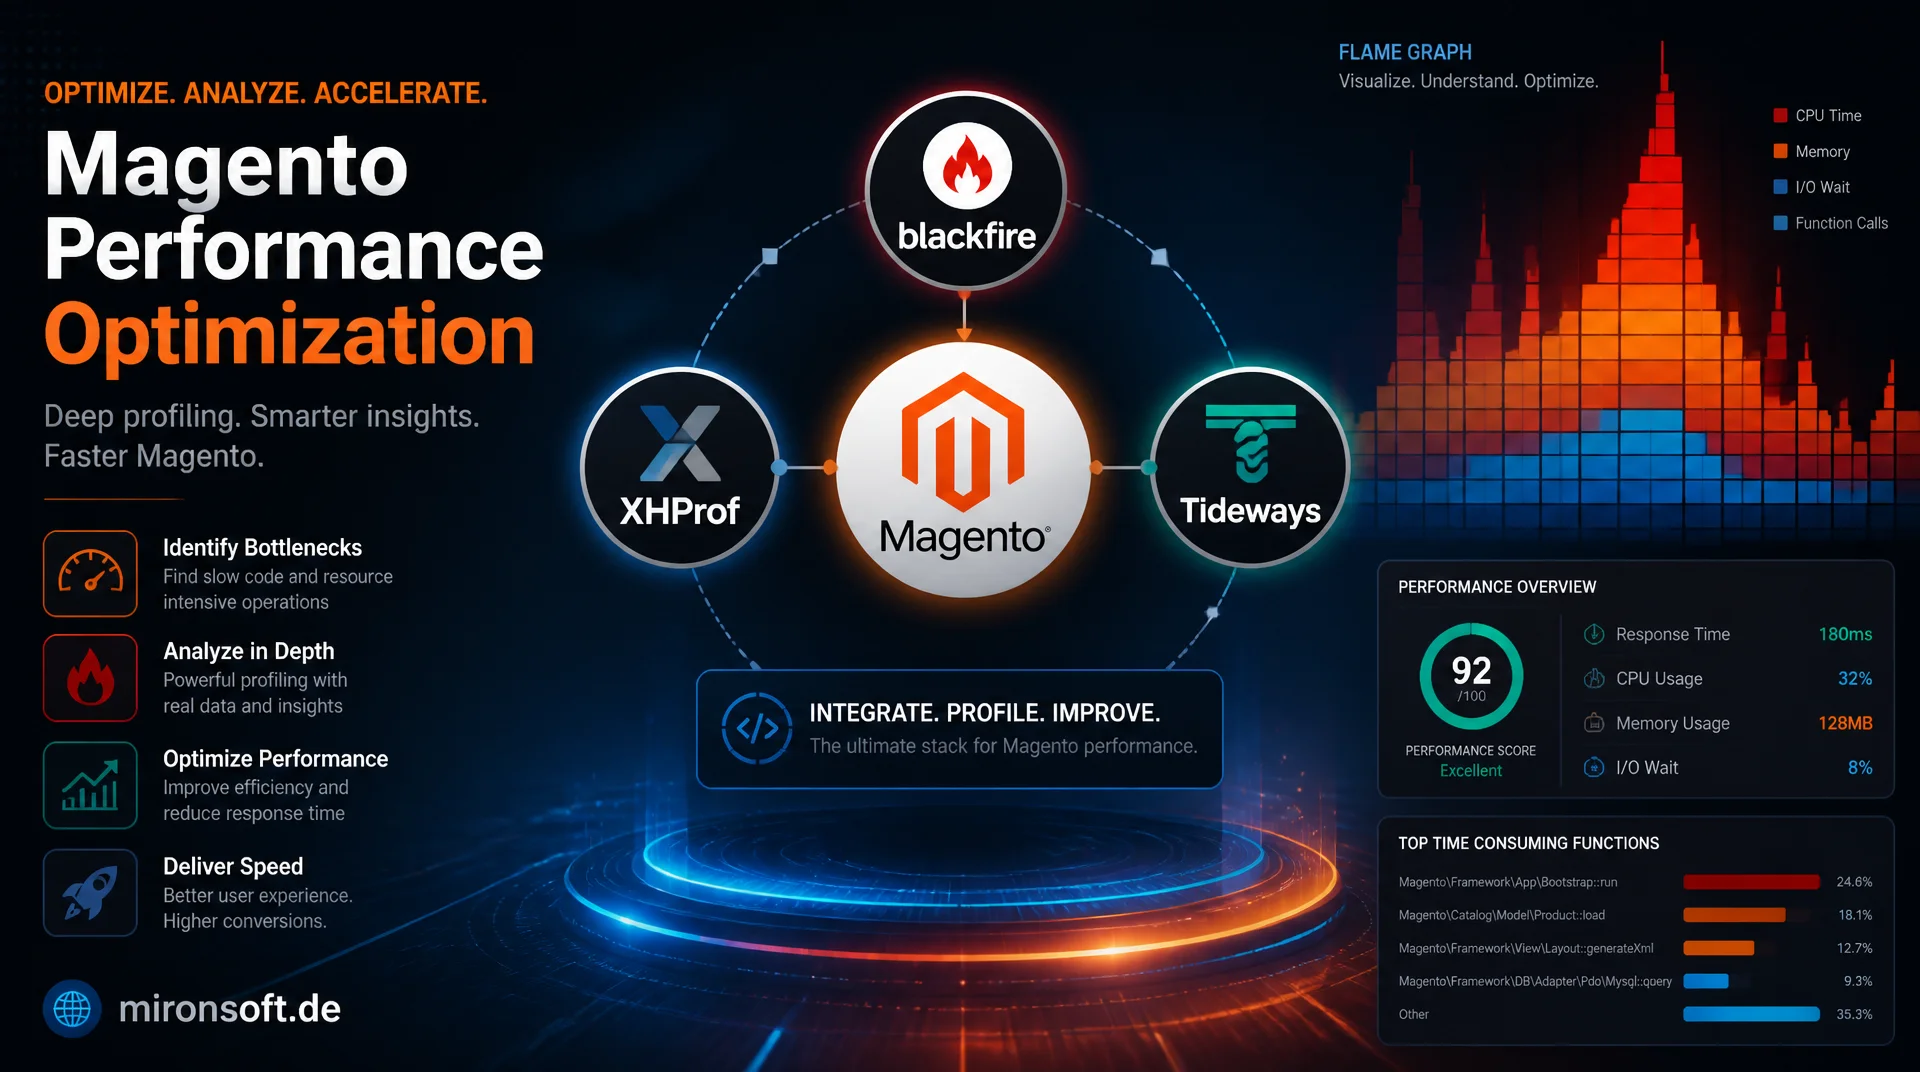
Finding hot paths before they slow down checkout
Chasing Magento performance problems by guesswork wastes time on the wrong things. This article shows how to use Blackfire, Xhprof and Tideways, and the built-in Magento Profiler to read flame graphs, identify slow observers and plugins, and compare profiles cleanly, including safe sampling in production.
Table of Contents
- 1. Why systematic profiling beats guessing
- 2. Profiling tools at a glance
- 3. Setting up the Blackfire probe and agent
- 4. Configuring Xhprof and Tideways
- 5. The built-in Magento Profiler
- 6. Reading flame graphs and call graphs correctly
- 7. Identifying hot paths: observers, plugins, templates
- 8. Comparing before/after profiles cleanly
- 9. Safe production profiling with sampling
- 10. Summary
- 11. FAQ
1. Why systematic profiling beats guessing
The most common mistake with Magento performance problems: a developer guesses the cause based on gut feeling, optimizes a supposedly expensive spot in the code, and then wonders why response time barely improved. Without measurement, every optimization stays a guessing game, because the actually expensive code paths in Magento rarely sit where intuition suggests, for example in deeply nested plugin chains, in observers that fire on every page load, or in template loops that trigger an extra DB query per product.
Profiling makes these costs visible by logging every function call with its time, memory usage, and call frequency. Instead of asking "What might be slow?", a profiler answers "What is actually slow, and how often is it called?". Especially in grown Magento installations with many third-party modules, this is the only reliable way to distinguish between core system, plugins, and custom code, and to apply optimization where it has the largest effect on total runtime.
2. Profiling tools at a glance
Four tool categories are essentially relevant for Magento, and they differ significantly in overhead, production-readiness, and granularity. Blackfire is a commercial SaaS profiling tool with a PHP probe and a local agent that delivers detailed call graphs including I/O and SQL timings, comparable via a web UI. Xhprof, originally built by Facebook, and its actively maintained successor Tideways, measure similar data as a PHP extension with very low overhead and are particularly well suited for continuous sampling.
Magento's own Magento\Framework\Profiler is a timer-based built-in tool with no external dependencies, ideal for quick ad-hoc analysis directly in the dev setup. In addition, MySQL's query log helps track down individual N+1 query problems, but delivers no PHP-side time breakdown. In practice, the tools complement each other: Blackfire and Xhprof/Tideways for deep call graph analysis, the Magento Profiler for fast local checks, and the query log as a targeted diagnostic tool.
3. Setting up the Blackfire probe and agent
Blackfire consists of two components: a PHP probe that runs as an extension inside the PHP container and collects measurement data, and an agent that bundles this data and transmits it encrypted to the Blackfire cloud. In the Mark Shust Docker setup, the probe gets installed directly in the PHP-FPM container, after which server ID, server token, client ID, and client token from the Blackfire dashboard need to be registered so local profiles are correctly attributed to the project.
After restarting PHP-FPM, a single request can be profiled deliberately by calling it with blackfire curl instead of a regular HTTP client, or via the browser extension right in the running store. For CLI commands such as indexer runs or cron jobs, prefixing with blackfire run works just as reliably and is especially useful when a reindex suddenly takes noticeably longer after a deployment.
# Install Blackfire probe and agent inside the Magento PHP container (Mark Shust setup)
bin/cli bash -c "curl -sS https://get.blackfire.io/blackfire.gpg | apt-key add - \
  && echo 'deb http://packages.blackfire.io/debian any main' > /etc/apt/sources.list.d/blackfire.list \
  && apt-get update && apt-get install -y blackfire-php blackfire-agent"

# Register the environment credentials from the Blackfire dashboard
bin/cli blackfire-agent -config /etc/blackfire/agent.toml -server-id="<server-id>" -server-token="<server-token>"
bin/cli blackfire-php-config --client-id="<client-id>" --client-token="<client-token>"

# Restart PHP-FPM so the probe extension gets loaded
bin/restart

# Profile a single request through the Blackfire agent instead of a plain HTTP client
bin/cli blackfire curl https://mironsoft.test/catalogsearch/result/?q=shirt

# Profile a CLI command, e.g. a reindex run that got slow after a deployment
bin/cli blackfire run php bin/magento indexer:reindex catalog_category_product
4. Configuring Xhprof and Tideways
Tideways ships a modern, actively maintained Xhprof-compatible extension that gets enabled via an ini file and, unlike classic Xhprof, also supports production-safe sampling. The central setting is tideways.sample_rate: a value of 0 disables automatic sampling and allows targeted manual profiling of individual requests, while a value greater than 0 automatically records a fixed percentage of all requests without any developer intervention.
For local debugging sessions, it's enough to load the extension with sampling disabled and start/stop profiles deliberately through the Tideways library or directly via xhprof_enable()/xhprof_disable(). The recorded raw data comes as a serialized PHP array and can either be uploaded to the Tideways cloud or visualized with a local call graph viewer like xhprof-viewer, which is especially handy in environments without internet access.
# Enable the Tideways xhprof-compatible extension in the PHP container
bin/cli bash -c "cat <<'EOF' > /usr/local/etc/php/conf.d/zzz-tideways.ini
extension=tideways_xhprof.so
tideways.sample_rate=0
tideways.auto_prepend_library=0
tideways.connection=tcp://127.0.0.1:9135
EOF"

# Reload PHP-FPM to pick up the new extension
bin/restart

# Confirm the extension is loaded and ready
bin/cli php -m | grep tideways
5. The built-in Magento Profiler
Besides external tools, Magento ships its own lightweight timer system, Magento\Framework\Profiler, which already has measurement points placed at strategic spots in the framework, for example to break out controller dispatch, layout generation, and block rendering separately. It's enabled via the MAGE_PROFILER environment variable, whose value determines the output format: html produces a collapsible tree of all timers including cumulative time and call count, csvfile writes machine-readable data for automated analysis.
The big advantage over Blackfire or Xhprof: no extra extension setup needed, the profiler is part of the framework and works immediately in any dev container. The downside: it only measures code paths where \Magento\Framework\Profiler::start()/::stop() calls have been explicitly placed, so it doesn't automatically cover every function like a full call graph profiler. For custom modules, additional timers can easily be added to isolate a suspicious code section on purpose.
# Enable Magento's built-in Framework\Profiler for a single CLI run
MAGE_PROFILER=html bin/magento indexer:reindex catalog_category_product

# The HTML profiler report is written next to the project root
ls -la src/var/log/profiler.html

# Enable it for regular web requests via the deployment configuration
bin/magento config:set dev/debug/profiler_type html

# Or trigger it ad-hoc for a single CLI command without touching persisted config
bin/cli bash -c "MAGE_PROFILER=html php bin/magento cache:status"
6. Reading flame graphs and call graphs correctly
A flame graph renders the call stack as stacked horizontal bars: the x-axis does not represent time in the classic sense, but the relative width of time spent in that function call, while the y-axis represents call depth. The wider a bar, the more total time was spent in that function and its subfunctions, regardless of how often it was called. Wide, flat bars high up in the graph are almost always the most rewarding optimization targets.
Blackfire additionally provides a call graph that displays functions as nodes and calls as directed edges with exclusive and inclusive time as well as call count. The key distinction is between exclusive time (just the function itself, excluding subfunctions) and inclusive time (the function plus all called subfunctions): a function with high inclusive but low exclusive time is usually just a dispatcher, while high exclusive time points to genuinely expensive code of its own, such as an inefficient loop or a missing query optimization.
7. Identifying hot paths: observers, plugins, templates
In Magento, performance problems typically concentrate on three spots: event observers that fire on every save or load of a model and unknowingly trigger extra DB queries or external API calls; plugins, which as an around interceptor wrap the actual method and, when implemented poorly, effectively double the entire call stack beneath them; and templates that issue additional repository calls per product or category inside a loop instead of loading data upfront. In a flame graph, such hot paths show up as wide, repeating patterns with a strikingly high number of calls to the same method.
A proven approach: first look for the widest bars in the flame graph below Magento\Framework\Event\Manager::dispatch or Magento\Framework\Interception\Interceptor, then click into the affected node to zoom into the call chain. For targeted manual profiling of an individual suspect, an observer or plugin can be temporarily wrapped with xhprof_enable()/xhprof_disable() to measure its cost in isolation from the rest of the request, without producing a full request profile.
<?php
declare(strict_types=1);

namespace Mironsoft\Performance\Observer;

use Magento\Framework\Event\Observer as EventObserver;
use Magento\Framework\Event\ObserverInterface;

/**
 * Wraps a suspected slow observer with a manual xhprof measurement window.
 * Only intended for temporary local debugging, never for production code.
 */
class ProfiledStockUpdateObserver implements ObserverInterface
{
    /**
     * Executes the original observer logic inside an isolated profiling window.
     *
     * @param EventObserver $observer
     * @return void
     */
    public function execute(EventObserver $observer): void
    {
        // Start a dedicated xhprof measurement just for this observer
        xhprof_enable(XHPROF_FLAGS_CPU | XHPROF_FLAGS_MEMORY);

        $this->runOriginalLogic($observer);

        $data = xhprof_disable();
        file_put_contents(
            '/tmp/xhprof/stock_update_' . microtime(true) . '.xhprof',
            serialize($data)
        );
    }

    /**
     * Placeholder for the actual observer logic under investigation.
     *
     * @param EventObserver $observer
     * @return void
     */
    private function runOriginalLogic(EventObserver $observer): void
    {
        // Original stock recalculation logic lives here
    }
}
8. Comparing before/after profiles cleanly
A single profiling session only shows a snapshot, which can be skewed by cache state, server load, or random network latency. Reliable conclusions only come from comparing multiple profiles under identical conditions: the same test data, the same cache warm-up state, multiple repetitions instead of a single measurement. Blackfire offers a built-in comparison feature for this, showing two profiles side by side with color-coded deltas per function, including the percentage improvement or regression.
For raw Xhprof/Tideways data, this job falls to a diff tool that reads two serialized profiles and computes the difference in call time, call count, and memory usage per function. Crucially, don't just compare total runtime, also compare the call count of individual functions: if a function's total time drops because it's called less often rather than because it got faster itself, that points to a structural rather than an algorithmic improvement, which matters when assessing the real root cause of the fix.
9. Safe production profiling with sampling
Full profiling of every single request isn't practical in production: the overhead of Xhprof-style extensions is low, but it adds up noticeably at high request rates, and Blackfire's full call graph creates additional I/O overhead through data transfer to the agent. The solution is sampling: only a small, randomly or deliberately selected percentage of requests actually gets profiled, say one to five percent, while the rest run completely normally without any measurement overhead.
Tideways natively supports automatic sampling via tideways.sample_rate, while Blackfire can be triggered for individual requests via a trigger header or combined with a custom middleware, for example only for requests with an unusually high response time above a threshold. Important for production use: health check endpoints and static assets should generally be excluded from profiling since they skew the picture without delivering relevant insights, and a rate limit prevents a sudden traffic spike from overloading the agent or the storage backend.
{
  "sampling": {
    "enabled": true,
    "rate": 0.01,
    "trigger_header": "X-Blackfire-Sample",
    "exclude_paths": [
      "/health-check",
      "/media/*",
      "/static/*"
    ],
    "max_profiles_per_hour": 120,
    "environments": ["production"]
  },
  "alert_thresholds": {
    "wall_time_ms": 800,
    "sql_queries": 40,
    "memory_mb": 128
  }
}
Tool comparison
The overview below summarizes when each profiling tool delivers the most value, measured by overhead, production-readiness, and the granularity of the collected data.
| Tool | Overhead | Production-safe | Typical use case |
|---|---|---|---|
| Blackfire | Low (approx. 2-5%) | Yes, with sampling/trigger | Targeted deep-dive debugging |
| Xhprof / Tideways | Very low (< 2%) | Yes, always-on capable | Continuous monitoring |
| Magento Profiler | Medium to high | No, debug mode only | Fast local ad-hoc analysis |
| Query log | High while active | No | Tracking down individual N+1 queries |
In practice, the tools complement rather than replace each other: Xhprof/Tideways with a low sampling rate runs continuously in production and delivers early warning signals, Blackfire gets used for deeper investigation of individual requests, and the Magento Profiler remains the fastest tool for a first local check before installing any external extension at all.
Mironsoft
Profiling, performance debugging, and Hyvä optimization for Magento stores
Ready to find the hot paths in your store?
We set up Blackfire and Xhprof/Tideways in your dev and production setup, read the flame graphs for you, and implement the identified optimizations directly in your Magento and Hyvä code.
Profiling setup
Clean integration of Blackfire probe/agent and Xhprof/Tideways in Docker
Hot path analysis
Identifying and fixing slow observers, plugins, and templates
Production sampling
Safe, continuous profiling without noticeable overhead
10. Summary
Magento profiling with Blackfire and Xhprof solves one core problem: instead of assumed causes, flame graphs and call graphs deliver measurable facts about which observers, plugins, or templates actually cost time. Blackfire is suited for deep, targeted investigations with a full call graph, Xhprof and Tideways for continuous, resource-friendly sampling that keeps running in production without noticeably slowing down the store. The built-in Magento Profiler remains the fastest tool for a first local check without any additional extension.
The decisive lever is rarely a single spectacular optimization, but consistent practice: profile before every optimization, profile again afterward, and compare the two profiles directly. Anyone who establishes this routine and keeps low-rate production sampling permanently active catches performance regressions before they become a real problem for users and revenue.
Magento Profiling - The Essentials at a Glance
Blackfire for deep dives
Full call graph with I/O and SQL timings, ideal for targeted debugging of individual requests.
Xhprof/Tideways for monitoring
Very low overhead, production-safe sampling via tideways.sample_rate.
Magento Profiler for quick checks
MAGE_PROFILER=html with no extra extension, ideal for local ad-hoc analysis.
Always compare
Compare before/after profiles under identical conditions, checking call count as well as total time.