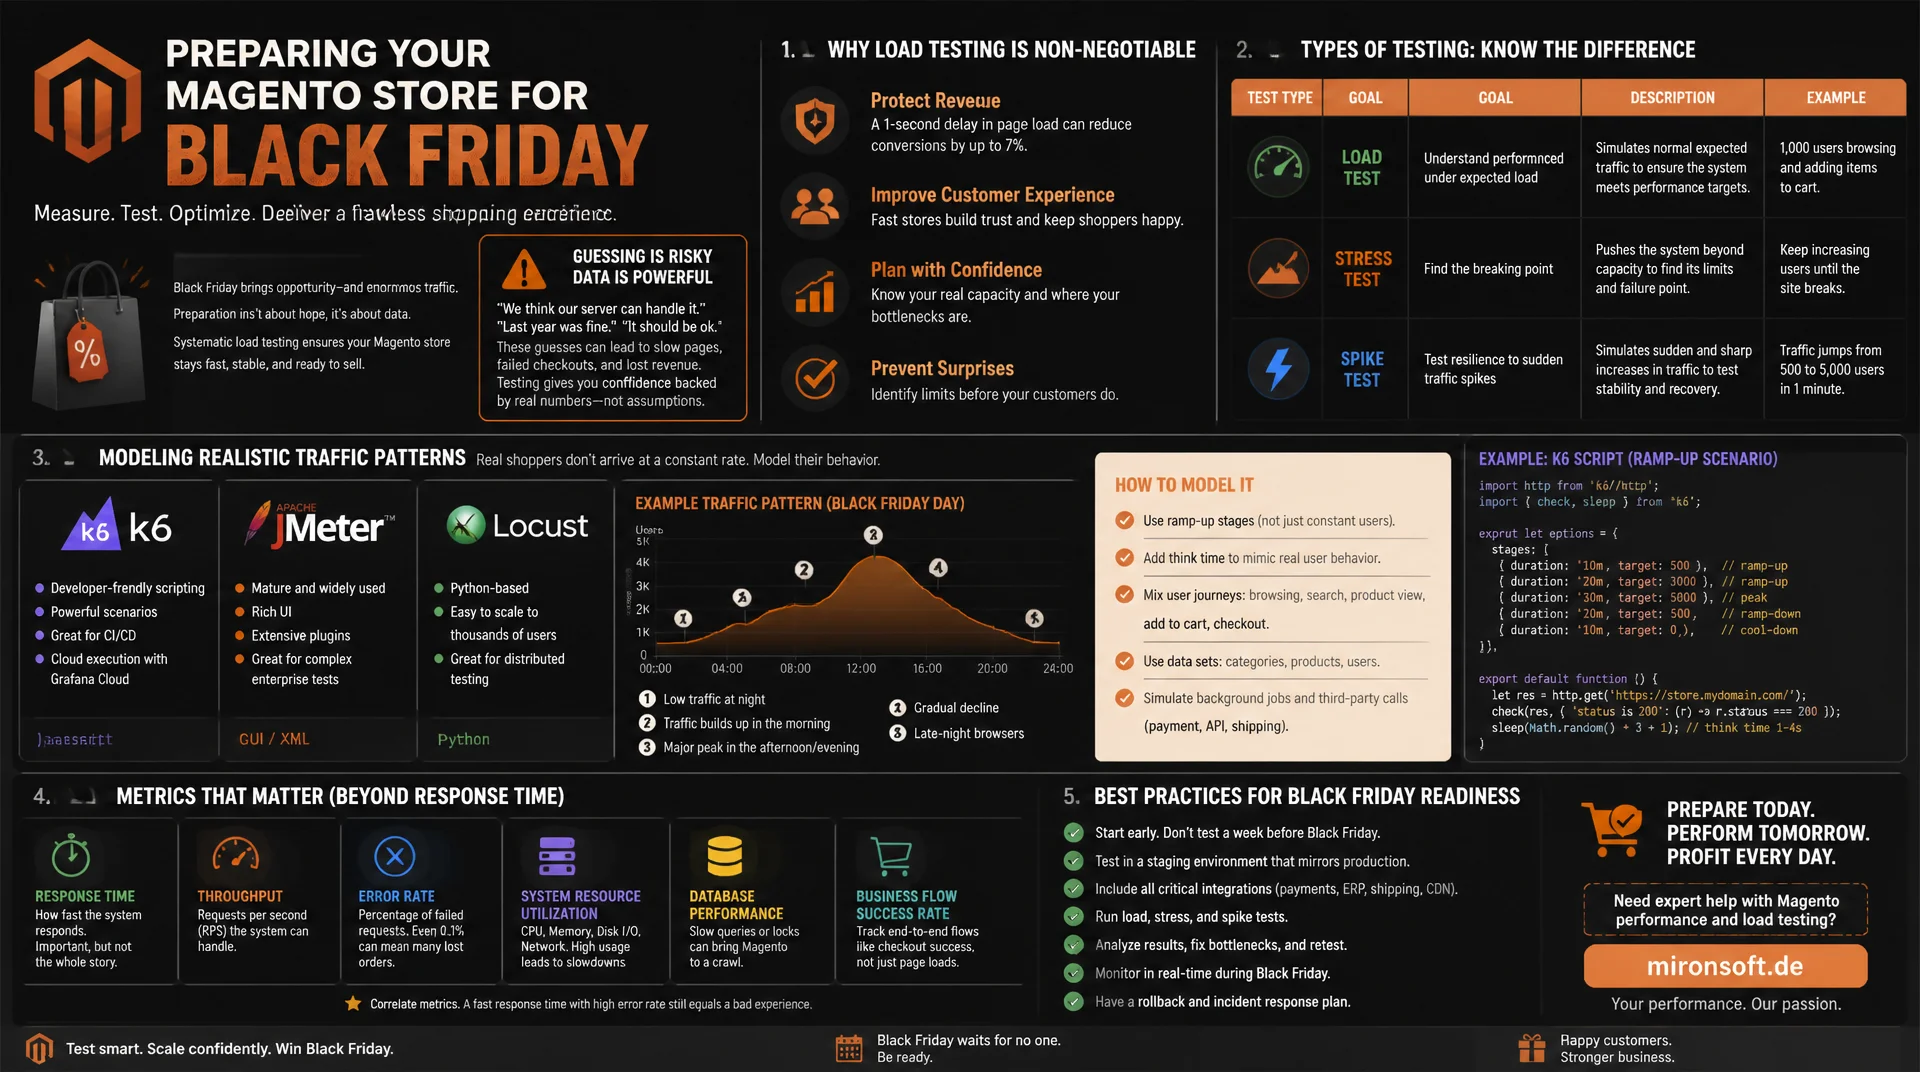
Simulate Black Friday traffic realistically before it happens
Running a Magento store into Black Friday without systematic load testing means relying on guesses instead of measurements. This article shows how load, stress, and spike tests differ, how to model realistic traffic patterns with k6, JMeter, and Locust, and which metrics beyond response time actually determine a store's true capacity.
Table of Contents
- 1. Load testing, stress testing, and spike testing compared
- 2. Realistic traffic patterns for Black Friday scenarios
- 3. Simulating think time and user behavior realistically
- 4. Weighting the cart and checkout funnel in the load model
- 5. Tooling comparison: k6, JMeter, and Locust
- 6. Beyond response time: error rate and throughput
- 7. Database connections, queue depth, and cache hit ratio under load
- 8. Why the staging environment must genuinely mirror production
- 9. CI/CD automation and tooling compared side by side
- 10. Summary
- 11. FAQ
1. Load testing, stress testing, and spike testing compared
Load testing, stress testing, and spike testing are often used interchangeably in practice, even though they answer different questions. Load testing simulates the expected, realistic load over a sustained period, such as the forecasted traffic for the Black Friday weekend, and checks whether the store stays within defined response times and error rates under that load. The goal isn't to find a breaking point, but to confirm that a concrete, planned load is served reliably, including checkout, payment integration, and stock checks under realistic concurrency.
Stress testing deliberately goes beyond expected capacity until the system hits its limit or fails. What matters isn't the failure itself, but how it happens: does the store degrade in a controlled way, for example through queues or rate limits, or does it collapse abruptly with 502 errors and exhausted database connection pools? Stress tests reveal the capacity headroom as a percentage and show which component limits first, usually the MySQL connection pool size or the PHP-FPM worker pool, less often raw network bandwidth.
Spike testing checks the response to a sudden, short burst of traffic with no ramp-up, the kind produced by a newsletter send, an influencer mention, or the exact start time of a flash sale. Unlike a load test, the traffic here doesn't rise over minutes but jumps to a multiple of baseline within seconds. Spike tests reveal whether autoscaling reacts fast enough, whether the cache is cold right after a deployment, and whether the system returns to normal after the spike instead of staying stuck in a degraded state.
2. Realistic traffic patterns for Black Friday scenarios
A realistic load model for Black Friday traffic doesn't start with the number of virtual users, it starts with the ramp-up curve. Real traffic rarely rises linearly: email campaigns and push notifications produce a steep spike in the minutes right after send, followed by a plateau and a slower decay over hours. A load test that instead ramps up evenly over 30 minutes tests a scenario that never occurs in reality, and it masks exactly the bottlenecks that show up during the actual rush.
Concurrent user modeling distinguishes between virtual users (VUs) and actual throughput: a VU that fires requests constantly produces a completely different load than a VU with realistic think time between clicks. For Magento stores, a staged model with multiple stages is recommended, mapping baseline traffic, the ramp during the campaign window, and the peak load at the moment the sale starts as separate phases, each with its own target VU count and duration, exactly as k6 natively supports through the stages configuration.
// k6 load test: Black Friday ramp-up scenario for a Magento storefront
import http from 'k6/http';
import { sleep, check } from 'k6';
import { randomIntBetween } from 'https://jslib.k6.io/k6-utils/1.2.0/index.js';

export const options = {
  scenarios: {
    // Baseline browsing traffic: category and product pages
    browsing: {
      executor: 'ramping-vus',
      exec: 'browseCatalog',
      startVUs: 50,
      stages: [
        { duration: '5m', target: 200 },   // early campaign ramp-up
        { duration: '10m', target: 800 },  // plateau during peak hour
        { duration: '15m', target: 800 },  // sustained peak
        { duration: '10m', target: 150 },  // gradual decay
      ],
    },
    // Checkout traffic: smaller share, weighted funnel
    checkout: {
      executor: 'ramping-vus',
      exec: 'runCheckout',
      startVUs: 5,
      stages: [
        { duration: '5m', target: 20 },
        { duration: '10m', target: 80 },
        { duration: '15m', target: 80 },
        { duration: '10m', target: 15 },
      ],
    },
  },
  thresholds: {
    http_req_duration: ['p(95)<800'],
    http_req_failed: ['rate<0.01'],
  },
};

export function browseCatalog() {
  const res = http.get(`${__ENV.TARGET_URL}/catalog/category/view/id/24`);
  check(res, { 'status is 200': (r) => r.status === 200 });
  sleep(randomIntBetween(2, 8)); // think time between page views
}

export function runCheckout() {
  http.get(`${__ENV.TARGET_URL}/checkout/cart`);
  sleep(randomIntBetween(3, 6));
  const res = http.post(`${__ENV.TARGET_URL}/checkout/onepage/success`);
  check(res, { 'checkout completed': (r) => r.status === 200 });
}
3. Simulating think time and user behavior realistically
Without think time, a load test simulates bots, not humans. Real users spend time on the product detail page, read reviews, compare variants, that creates pauses between requests, which need to be modeled in a load model as sleep() calls with realistic spread, typically 2 to 8 seconds instead of a fixed value. A test without think time produces artificially high requests-per-second numbers with an unrealistically small number of virtual users, leading to wrong capacity assumptions, because real users never send requests back to back that tightly.
Equally important is spreading think time using a random distribution instead of a fixed value, because synchronized VUs otherwise fire requests in lockstep and create artificial load spikes that don't exist in real traffic, an artifact known as coordinated omission. k6 and Locust both offer built-in randomization functions like randomIntBetween() that spread think time across a range and let each virtual user act slightly out of phase with the others.
4. Weighting the cart and checkout funnel in the load model
Not every user behaves the same way, and a load model that weights all requests equally overestimates capacity at the most critical point: the checkout. In a typical e-commerce funnel, far more users visit the homepage and category pages than actually reach the payment page, realistic distributions often sit around 100% page views, 40% product detail pages, 15% cart, and 5% completed checkout. A load test has to reflect this funnel shape instead of generating checkout requests at the same frequency as product page views.
Technically, this weighting is implemented in k6 through scenarios with different VU shares, or in JMeter through thread groups with their own distributions. It matters that the checkout path, despite its smaller share of requests, generates disproportionately heavy load on the database, because stock checks, price calculation, discount logic, and payment integration all converge there synchronously. A load model that underestimates the checkout share overlooks exactly the point where a store first breaks down under real Black Friday load.
5. Tooling comparison: k6, JMeter, and Locust
k6 from Grafana Labs scripts test scenarios in JavaScript/ES6 but compiles them internally to Go routines, producing significantly more load per test machine than interpreted alternatives. For distributed load generation, k6 relies on k6 Cloud or the Kubernetes operator, which starts multiple pods in parallel as load generators and aggregates results centrally. Its built-in threshold system lets a test automatically pass or fail based on SLA criteria like p95 response time or error rate, ideal for CI/CD integration.
Apache JMeter is the most established tool, with the largest plugin library and a GUI for visually building test plans, but it scales with noticeably higher memory usage per thread than k6, because every virtual user is a real JVM thread. Distributed execution works through a master-slave mode with multiple remote instances. Locust scripts scenarios in plain Python, lowering the barrier to entry for teams with a Python background, and natively distributes load across multiple worker processes and machines, controlled by a master process with a web UI for live observation of the running load.
#!/usr/bin/env bash
# run-load-test.sh - execute k6 against a specific environment
set -euo pipefail

ENVIRONMENT="${1:?Usage: run-load-test.sh <staging|production>}"

case "$ENVIRONMENT" in
  staging)
    TARGET_URL="https://staging.mironsoft-shop.de"
    ;;
  production)
    TARGET_URL="https://shop.mironsoft.de"
    echo "[WARN] Running against production, confirm before proceeding"
    ;;
  *)
    echo "[ERROR] Unknown environment: $ENVIRONMENT" >&2
    exit 1
    ;;
esac

k6 run \
  --env TARGET_URL="$TARGET_URL" \
  --out json=results/k6-"$(date +%Y%m%d-%H%M%S)".json \
  --summary-export=results/summary.json \
  black-friday-scenario.js
6. Beyond response time: error rate and throughput
Response time alone hides how a system actually degrades under load. The error rate is the most important secondary metric: a store that suddenly starts producing HTTP 500s or timeouts under rising load is failing, even if the average response time of successful requests still looks unremarkable. Equally decisive is throughput degradation, the point at which requests per second stop growing, or even drop, despite a continuously rising number of virtual users. That's the most reliable signal for the actual capacity limit, more reliable than any single response time value.
Queue depth in PHP-FPM, Nginx, or an upstream message queue shows whether requests are already waiting before they're even processed, an early warning signal that often shows up minutes before a visible response time increase. k6 lets you capture such metrics through Trend and Counter custom metrics directly inside the test script and evaluate them alongside the standard metrics, instead of reconstructing them after the fact from separate server logs.
{
  "thresholds": {
    "http_req_duration": ["p(95)<800", "p(99)<1500"],
    "http_req_failed": ["rate<0.01"],
    "checkout_duration": ["p(95)<2000"],
    "db_queue_depth": ["p(95)<50"]
  },
  "summaryTrendStats": ["avg", "min", "med", "p(90)", "p(95)", "p(99)", "max"],
  "noConnectionReuse": false,
  "discardResponseBodies": true
}
7. Database connections, queue depth, and cache hit ratio under load
Database connection saturation is usually the first hard limit in Magento stores under load, long before the web server's CPU or memory is exhausted. Every PHP-FPM worker holds a MySQL connection while it's processing a request, and once max_connections is reached, new requests either wait or fail with connection errors. During a load test, SHOW STATUS LIKE 'Threads_connected' or the equivalent cloud metric should be watched in parallel with the test run, so the saturation point can be tied precisely to a load level instead of being reconstructed later from a postmortem.
The cache hit ratio of Redis or Varnish often changes dramatically under load, because new product combinations, special prices, and personalized segments create cache entries that never occur in normal operation. A hit ratio of 95% at rest can drop to 70% under Black Friday load with many new discount codes, and every cache miss then triggers a full application rebuild that puts additional strain on the database. A good load test measures this ratio live through INFO stats in Redis or Varnish VCL statistics, not just the resulting response time.
#!/usr/bin/env bash
# monitor-saturation.sh - poll DB connections and cache hit ratio during a load test
set -euo pipefail

INTERVAL=5
LOG_FILE="results/saturation-$(date +%Y%m%d-%H%M%S).csv"

echo "timestamp,mysql_threads_connected,mysql_max_connections,redis_hit_ratio" > "$LOG_FILE"

while true; do
  connected=$(mysql -N -e "SHOW STATUS LIKE 'Threads_connected';" | awk '{print $2}')
  max_conn=$(mysql -N -e "SHOW VARIABLES LIKE 'max_connections';" | awk '{print $2}')

  hits=$(redis-cli INFO stats | grep keyspace_hits | cut -d: -f2 | tr -d '\r')
  misses=$(redis-cli INFO stats | grep keyspace_misses | cut -d: -f2 | tr -d '\r')
  hit_ratio=$(awk -v h="$hits" -v m="$misses" 'BEGIN { print (h+m > 0) ? h/(h+m) : 1 }')

  echo "$(date -Iseconds),$connected,$max_conn,$hit_ratio" >> "$LOG_FILE"
  sleep "$INTERVAL"
done
8. Why the staging environment must genuinely mirror production
A load test is only as meaningful as the environment it runs against. A staging environment with half the server size, a tenth of the product catalog, and an empty cache produces results that have nothing to do with production, neither the absolute response times nor the point at which the system tips over can be reliably transferred. Infrastructure parity means: the same instance types, the same PHP-FPM worker count, the same database configuration, and, where possible, the same network topology including CDN and load balancer.
Just as decisive is the cache warmup state: a freshly deployed store with a cold Redis and Varnish cache behaves fundamentally differently under load than a system that's been running for days with a warm cache, because virtually every first request results in a full page rebuild. Staging tests should therefore either deliberately cover the cold-start case or warm the cache before the actual load test, depending on which scenario is being tested. Data volume parity rounds this out: a catalog with 500 products instead of 50,000 changes index sizes, category tree depth, and search index performance so dramatically that test results on a scaled-down dataset barely translate to production.
9. CI/CD automation and tooling compared side by side
Load tests that only run manually before major events catch regressions too late. The more robust practice integrates a reduced load test as its own stage in the CI/CD pipeline, automatically checking defined thresholds for p95 response time, error rate, and throughput after every deployment to staging. k6 returns a clear exit code for this through Thresholds, which fails the pipeline when a threshold is exceeded, exactly like a failed unit test.
For the real Black Friday preparation run, the CI pipeline alone isn't enough: it also takes a large-scale, scheduled load test against a fully production-like staging environment, typically one to two weeks before the event, with enough time buffer to fix discovered bottlenecks and test again. CI integration catches regressions in day-to-day operations, while the big preparation run validates the actual capacity for exceptional traffic.
# .gitlab-ci.yml excerpt: automated load test stage against staging
stages:
  - deploy
  - load-test

deploy_staging:
  stage: deploy
  script:
    - ./deploy.sh staging
  environment:
    name: staging

k6_load_test:
  stage: load-test
  image: grafana/k6:latest
  needs: ["deploy_staging"]
  script:
    - k6 run --env TARGET_URL=https://staging.mironsoft-shop.de
        --summary-export=summary.json
        black-friday-scenario.js
  artifacts:
    when: always
    paths:
      - summary.json
    expire_in: 30 days
  rules:
    - if: '$CI_COMMIT_BRANCH == "main"'
k6, JMeter, and Locust solve the same task with different priorities around scripting language, resource usage, and distributed load generation. The table below summarizes what each tool is best suited for, complementing the tooling breakdown from section 5.
| Tool | Scripting language | Typical limitation | Recommendation |
|---|---|---|---|
| k6 | JavaScript/ES6 (compiled to Go) | No native GUI, scripting required | Best choice for CI/CD and resource-efficient tests |
| JMeter | Java (GUI test plans or XML) | High memory usage per thread | Largest plugin library, established ecosystem |
| Locust | Python | Requires Python skills on the team | Very flexible for complex, code-based scenarios |
In practice, a tool's raw throughput rarely decides the choice, fit with the team and the existing toolchain does. Teams already using JavaScript in the CI/CD pipeline integrate k6 most smoothly. Teams with Python backend expertise find their footing in Locust faster. JMeter remains the right choice when non-engineering teams need to build test plans themselves without writing code.
Mironsoft
Load testing, performance engineering, and scaling consulting for Magento stores
Ready for the next Black Friday?
We build realistic load models for your Magento store, identify the actual capacity limit, and harden checkout, database, and cache specifically for the rush, with k6 test suites that stay permanently in your CI/CD pipeline.
Load testing setup
Realistic k6 or JMeter scenarios with ramp-up curves and checkout funnel weighting
Capacity audit
Systematically analyzing database connections, queue depth, and cache hit ratio under load
CI/CD integration
Establishing automated load tests with thresholds as a permanent pipeline stage
10. Summary
Load testing methodology for Magento stores starts with getting the terminology right: load tests confirm expected capacity, stress tests find the breaking point, spike tests check the response to abrupt load spikes. Realistic load models reflect ramp-up curves, think time, and the funnel shape of the checkout path instead of generating evenly distributed artificial load. k6, JMeter, and Locust differ mainly in scripting language, resource usage per virtual user, and the way they generate distributed load, the right choice depends on the team's skillset and the scaling required.
Response time is only one of many relevant metrics: error rate, throughput degradation, queue depth, database connection saturation, and cache hit ratio together show where and how a store actually fails under load. All of these measurements are only as trustworthy as the test environment itself, a staging environment without infrastructure, cache, and data volume parity to production produces results that point in the wrong direction when it counts. Continuous load tests in the CI/CD pipeline and a large preparation run before the actual event complement each other rather than replacing one another.
Load Testing Methodology for Magento Stores - The Essentials at a Glance
Load vs. stress vs. spike
Load tests confirm expected capacity, stress tests find the limit, spike tests check abrupt load spikes with no ramp-up.
Realistic load models
Ramp-up curves, spread think time, and checkout funnel weighting instead of evenly distributed artificial load.
Tooling
k6 for CI integration and resource efficiency, JMeter for plugin depth, Locust for Python teams.
Metrics & staging
Measure error rate, queue depth, and cache hit ratio alongside response time, always against a production-faithful staging environment.