systematically, not just enabling it
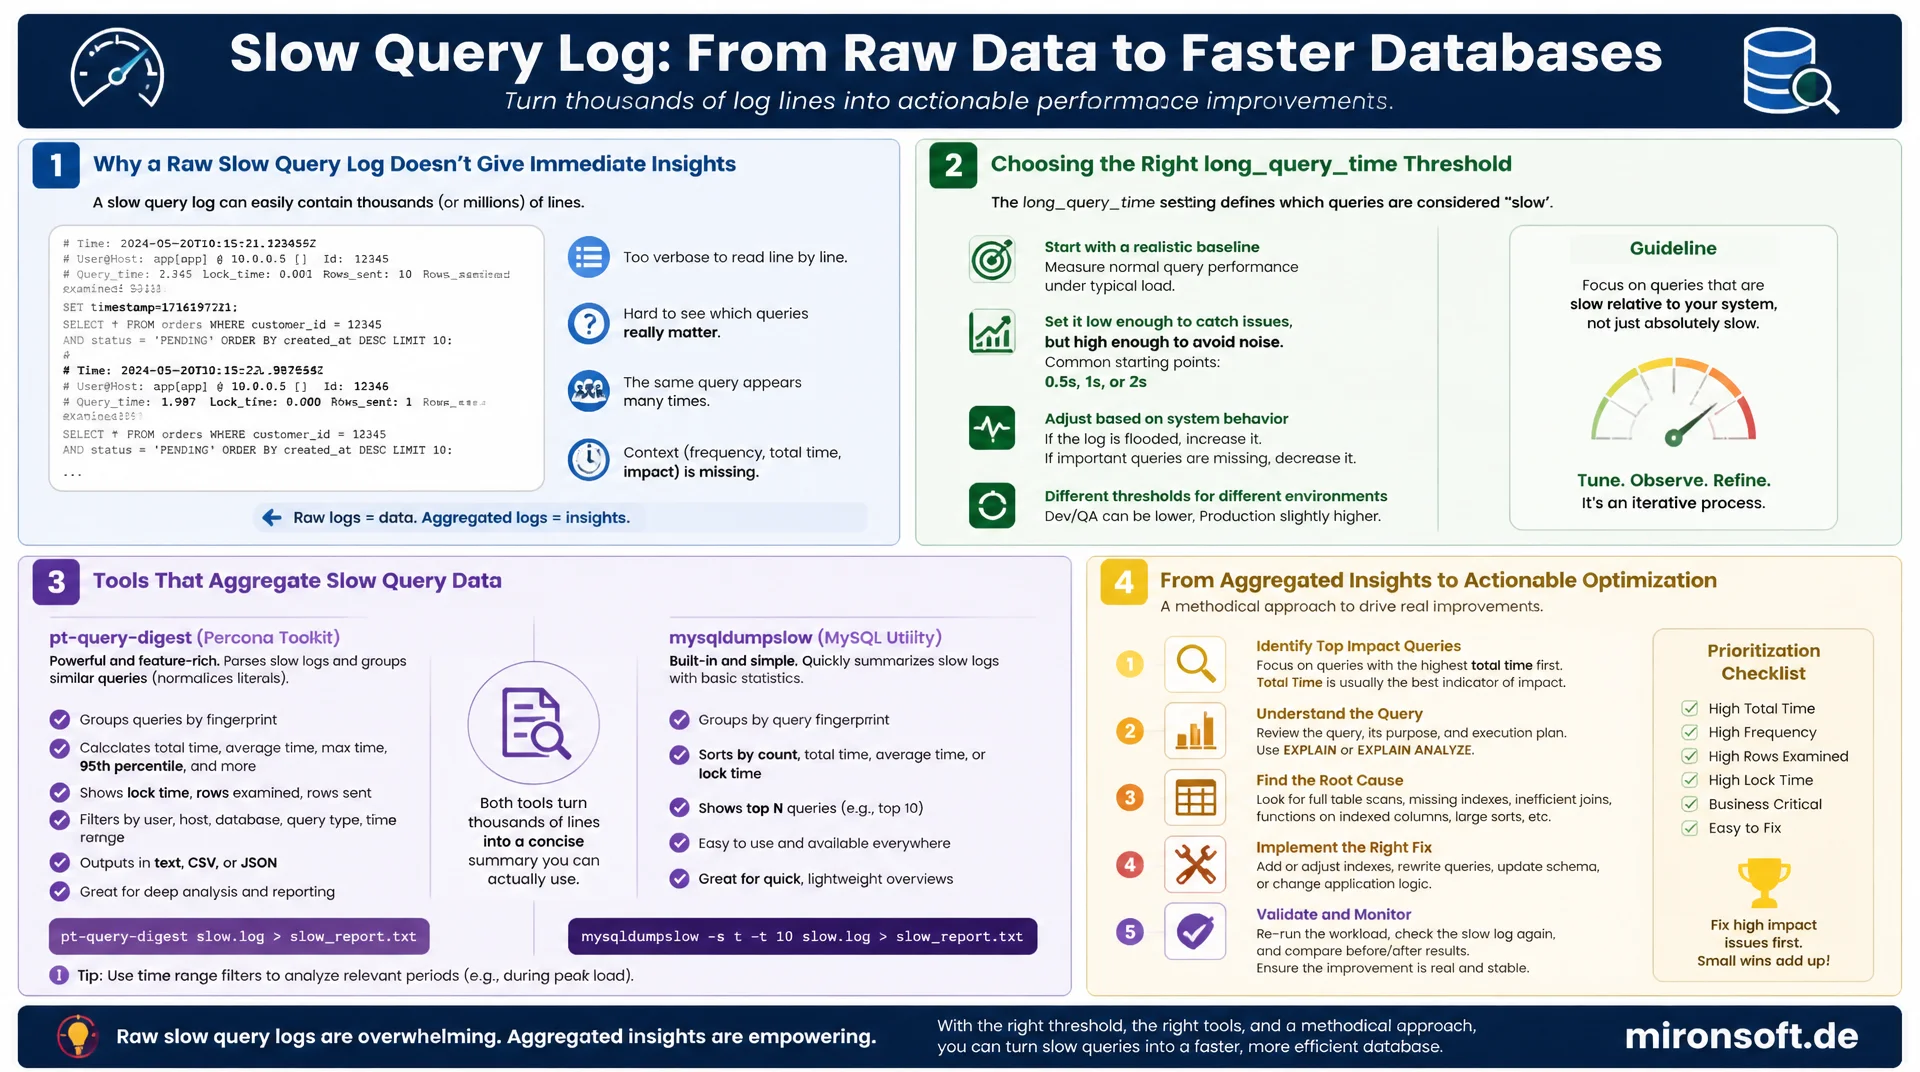
The slow query log is only the first step, because a raw file with thousands of lines does not deliver insight on its own. This article shows how to choose long_query_time sensibly, how pt-query-digest and mysqldumpslow aggregate the data, and how to turn that into a solid prioritization for the next round of optimizations.
Table of Contents
- 1. Enabling the slow query log
- 2. Choosing long_query_time correctly
- 3. log_queries_not_using_indexes and further parameters
- 4. pt-query-digest: aggregation and prioritization
- 5. mysqldumpslow as a lightweight alternative
- 6. Spotting patterns: which query types dominate
- 7. From log entry through EXPLAIN to a fix
- 8. Rotation and long term monitoring
- 9. Prioritization: impact as frequency times duration
- 10. Summary
- 11. FAQ
1. Enabling the slow query log
MySQL's slow query log records every query whose execution time exceeds a defined threshold, together with metadata such as execution time, the number of locked rows, and the number of examined records. It is enabled via the slow_query_log = 1 and slow_query_log_file variables, where the target path must point to a directory with enough disk space and appropriate write permissions for the MySQL process. Both variables can be set permanently in my.cnf or at runtime via SET GLOBAL, the latter without a server restart, which is convenient for targeted diagnostic sessions.
A common mistake is enabling the slow query log and then forgetting to analyze it systematically. The file then grows unchecked without anyone using the contained information, until disk space eventually runs low or an incident finally brings the file to attention. The slow query log only delivers value through regular, structured analysis, not through mere existence. A rotation scheme and a recurring analysis process should therefore be planned from the start, not only after the first performance incident.
In addition to simply enabling it, the log output format log_output = FILE is recommended over TABLE, since the file based variant can be read directly by external analysis tools such as pt-query-digest, while the table variant produces additional write overhead on the mysql.slow_log system table. For production instances under heavy load, file based logging is almost always the better choice.
-- Enable the slow query log at runtime (no restart needed)
SET GLOBAL slow_query_log = 'ON';
SET GLOBAL slow_query_log_file = '/var/log/mysql/slow-query.log';
SET GLOBAL log_output = 'FILE';

-- Verify current status
SHOW VARIABLES LIKE 'slow_query_log%';
-- +---------------------+-------------------------------+
-- | Variable_name       | Value                         |
-- +---------------------+-------------------------------+
-- | slow_query_log      | ON                            |
-- | slow_query_log_file | /var/log/mysql/slow-query.log |
-- +---------------------+-------------------------------+
2. Choosing long_query_time correctly
The long_query_time variable determines, in seconds, above which execution duration a query counts as slow and is recorded in the slow query log. The default value of 10 seconds is far too high for most modern web applications, because a query that takes three seconds is already catastrophically slow for an online shop and would never appear in the log under this default. For production systems, a value between 0.1 and 1 second has established itself as a practical starting point, depending on the nature of the application.
A threshold set too low, for example 0.01 seconds on a heavily used system, leads to the opposite problem, the slow query log then grows so fast that the actually relevant slow queries get buried in the noise of unremarkable but frequent ones. An iterative approach works well: start with a moderate value such as 0.5 seconds, review the results, and then gradually lower it depending on data volume and informational value, until the ratio of insight to log volume feels right.
For one off, deep diagnostic sessions, long_query_time can be temporarily set to a very low value such as 0, to effectively log every query, combined with log_slow_admin_statements for administrative commands. This naturally produces a large volume of data and should only remain active under observation for a limited period, never permanently in production.
-- Iterative tuning: start moderate, then narrow down
SET GLOBAL long_query_time = 0.5;   -- catches anything slower than 500ms
-- After reviewing results for a day, tighten further if the volume is manageable
SET GLOBAL long_query_time = 0.2;   -- catches anything slower than 200ms

-- Temporary deep diagnostic session (short window only!)
SET GLOBAL long_query_time = 0;
SET GLOBAL log_slow_admin_statements = 'ON';
-- ... run the diagnostic window for a few minutes, then revert:
SET GLOBAL long_query_time = 0.5;
3. log_queries_not_using_indexes and further parameters
Beyond the plain time threshold, MySQL offers additional parameters that specifically extend the slow query log. log_queries_not_using_indexes = 1 logs every query that does not use an index, regardless of its execution time. This is especially valuable, because a query on a currently small table without an index may be fast enough today but becomes a problem as data volume grows, long before it crosses the regular time threshold.
The min_examined_row_limit parameter filters out queries that take a long time but examine only a few rows, often a sign of external factors like lock wait time rather than genuine query inefficiency. Conversely, log_throttle_queries_not_using_indexes, available since MySQL 5.7, limits the flood of identical warnings for the same unindexed query instead of generating a full entry on every single execution. This fine grained control keeps the slow query log from becoming cluttered with redundant entries.
# my.cnf: recommended slow query log configuration for production
[mysqld]
slow_query_log = 1
slow_query_log_file = /var/log/mysql/slow-query.log
long_query_time = 0.5
log_queries_not_using_indexes = 1
log_throttle_queries_not_using_indexes = 60
min_examined_row_limit = 100
log_output = FILE
4. pt-query-digest: aggregation and prioritization
A raw slow query log with thousands of entries is barely manually reviewable by a human. pt-query-digest from the Percona Toolkit normalizes the queries by replacing literals with placeholders, groups structurally identical queries together, and by default sorts the results by the total time a query class has consumed across all its executions. This is the decisive difference from simply looking at the single slowest query, because a query that takes 50 milliseconds but runs ten thousand times per hour often has a larger total impact than a single five second query that runs only once a day.
The output of pt-query-digest provides metrics for each query class such as execution count, minimum, average, and maximum execution time, as well as the sum of all examined rows. This aggregated view is the actual value of the tool, because it enables objective, data driven prioritization instead of relying on subjective guesses about which query is probably the biggest problem.
# Analyze the slow query log and produce a ranked digest report
pt-query-digest /var/log/mysql/slow-query.log > digest-report.txt

# Excerpt of typical output, sorted by total execution time
# Rank Query ID           Response time  Calls R/Call V/M   Item
# ==== ================== ============== ===== ====== ===== =========
#    1 0x9F3A...           842.31 68.2%  12043  0.0699  0.02 SELECT orders
#    2 0x4B21...           201.55 16.3%     89  2.2646  0.51 SELECT products
#    3 0x7C08...            94.72  7.7%   5502  0.0172  0.01 UPDATE inventory

# Focus on a single query class by its ID for full detail
pt-query-digest --filter '$event->{fingerprint} =~ m/select orders/i' \
  /var/log/mysql/slow-query.log
5. mysqldumpslow as a lightweight alternative
Where pt-query-digest cannot be installed or a faster solution without external dependencies is needed, the mysqldumpslow tool shipped with every MySQL distribution provides a simpler but functionally similar aggregation. It also normalizes literals into placeholders and groups by query pattern, but offers fewer metrics and much more rudimentary output formatting than pt-query-digest.
For quick checks directly on the database server, without first having to download the log file, mysqldumpslow is nonetheless practical. The -s t option sorts by total time, -s c by execution count, and -t N limits output to the N most relevant entries. For deeper analysis with histograms, percentages, and trend comparisons between multiple time periods, pt-query-digest remains the superior choice.
# Top 10 query patterns by total execution time
mysqldumpslow -s t -t 10 /var/log/mysql/slow-query.log

# Top 10 query patterns by number of occurrences
mysqldumpslow -s c -t 10 /var/log/mysql/slow-query.log

# Example output line (literals replaced with N and 'S')
# Count: 12043  Time=0.07s (842s)  Lock=0.00s (0s)  Rows=1.2 (14452)
#   SELECT * FROM orders WHERE customer_id = N AND status = 'S'
6. Spotting patterns: which query types dominate
After aggregation comes pattern classification. In practice, slow queries typically fall into recurring categories: missing or unsuitable indexes leading to full table scans, inefficient JOINs without matching index support on the join column, N+1 patterns with many structurally identical but very frequent queries, and large sort or group by operations without a supporting index that force MySQL into temporary tables and filesort operations.
Looking at the Rows_examined column relative to Rows_sent in the slow query log reveals a lot about the nature of the problem. If a query examines hundreds of thousands of rows just to return a few, that strongly points to a missing or poorly chosen index. If the number of examined and returned rows is instead similarly high, the problem is more likely the sheer data volume or a fundamentally too broad query that should probably be narrowed through pagination or more targeted filters.
7. From log entry through EXPLAIN to a fix
Once a prioritized query class has been identified from the slow query log, detailed analysis follows with EXPLAIN or EXPLAIN ANALYZE in MySQL 8.0. These tools show the actually chosen execution plan, which indexes the optimizer considered and actually used, and how many rows were estimated versus actually processed at each step. An execution plan with type: ALL signals a full table scan and, on large tables, is almost always a strong signal of a missing index.
After adding a matching index or rewriting the query, the fix should not only be verified in theory but again in the slow query log, ideally through another digest run after a few days of production traffic. Only that reliably proves that the affected query class has actually disappeared from the list of top contributors, instead of relying on a single, isolated test measurement.
| Symptom in the log | Likely cause | Diagnostic step | Typical fix |
|---|---|---|---|
| Rows_examined ≫ Rows_sent | Missing or wrong index | EXPLAIN: type ALL |
Add a composite index |
| Many identical query patterns | N+1 query problem | pt-query-digest count column | Eager loading / batch loading |
| High Lock_time | Lock contention, long transactions | SHOW ENGINE INNODB STATUS | Shorten transactions |
| Using filesort / temporary | Sorting without index support | EXPLAIN extra column |
Index on ORDER BY/GROUP BY |
8. Rotation and long term monitoring
An active slow query log without rotation grows without bound and can reach several gigabytes within a few days on heavily used systems. logrotate on Linux is the established solution, combined with a postrotate script that instructs MySQL via FLUSH LOGS to reopen the log file instead of continuing to write into the already rotated, renamed file. Without this step, the MySQL process may keep writing to a file descriptor that still points at the old, rotated file, which negates the effect of the rotation entirely.
For long term trends, it is worth running pt-query-digest automatically on a daily or weekly basis and storing the results in a dedicated table, combined with Percona Monitoring and Management or a comparable dashboard. That way, it becomes possible to observe over weeks whether a specific query class suddenly grows more frequent or slower after a deployment, a pattern that is easily missed in an isolated snapshot of the slow query log.
Mironsoft
Slow query analysis and database performance tuning
Slow query log enabled, but nobody analyzes it?
We set up a clean slow query log configuration with a sensible threshold, aggregate the data with pt-query-digest, and deliver a prioritized list of concrete fixes instead of an unstructured log file.
Log setup
Configuring long_query_time and rotation matched to system load
Digest reports
Recurring pt-query-digest analysis with trend comparison
Fix prioritization
Concrete indexes and query rewrites ranked by impact
9. Prioritization: impact as frequency times duration
The central formula for solid prioritization from the slow query log is: impact equals execution frequency multiplied by average duration, exactly the metric that pt-query-digest uses as its default sort criterion. A query that takes 50 milliseconds but runs ten thousand times per hour ties up more database resources in total than a single five second query that runs only once a day, even if the latter feels more dramatic at first glance.
Beyond the pure time sum, it is worth taking a second look at queries with high variance between minimum and maximum execution time, visible in the V/M column of pt-query-digest. Large fluctuations often point to lock wait times, insufficient buffer pool memory for certain data volumes, or plan instability due to outdated table statistics, problems that cannot be solved by an additional index alone but require deeper root cause analysis.
10. Summary
The slow query log alone delivers no value unless it is analyzed systematically. The right configuration starts with a sensible long_query_time, matched to the application's actual latency requirements instead of the not very helpful default of 10 seconds, complemented by log_queries_not_using_indexes for early warnings. pt-query-digest aggregates the raw data into prioritizable query classes, sorted by actual total impact instead of subjective impressions of individually slow queries.
The workflow from log entry through EXPLAIN to a concrete fix, followed by renewed verification in the slow query log after deployment, closes the loop. Rotation and recurring digest runs turn a one time snapshot into continuous performance monitoring that catches new regressions before they become a real production problem.
Analyzing the slow query log systematically: the essentials at a glance
Configuration
long_query_time between 0.1 and 1 second, enable log_queries_not_using_indexes.
Aggregation
pt-query-digest normalizes queries and sorts by total time across all executions.
Prioritization
Impact equals frequency times duration, not the single slowest query viewed in isolation.
Operations
Plan rotation with FLUSH LOGS and schedule regular digest runs for long term trends.