Health Checks und Diagnose
Praxisfertige SQL-Abfragen für systematisches MySQL Monitoring — von der Buffer Pool Hit Ratio über hängende Transaktionen bis zum Replikations-Lag. Direkt einsetzbar in Monitoring-Systemen und für manuelle Diagnose.
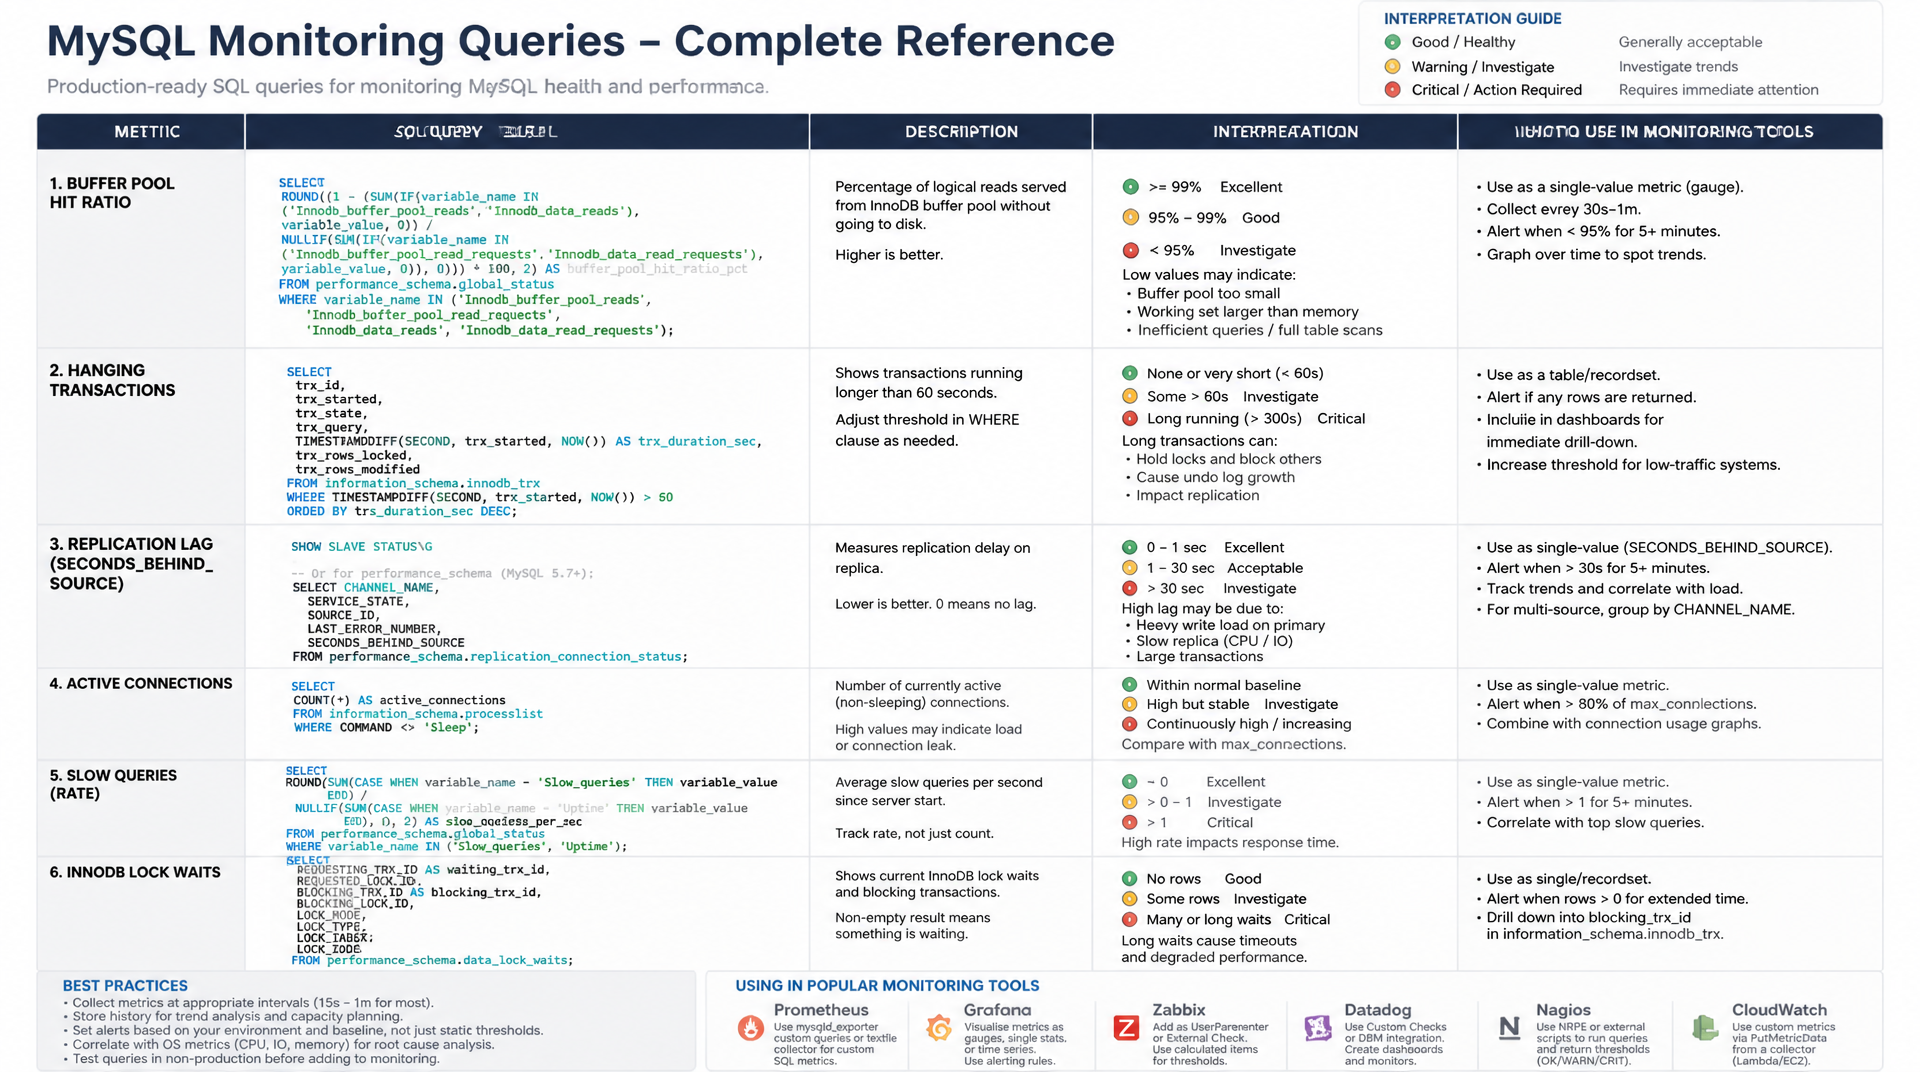
Warum SQL-basiertes MySQL Monitoring unverzichtbar ist
Externe Monitoring-Tools wie Prometheus, Datadog oder Grafana sind wertvoll — aber für präzise Datenbankdiagnosen führt kein Weg an direkten SQL-Abfragen gegen MySQL-Systemtabellen vorbei. MySQL Monitoring SQL ermöglicht es, exakt die Metriken abzufragen, die in einem konkreten Problemfall relevant sind: den aktuellen Zustand des Buffer Pools, laufende Transaktionen, Replikationsstatus oder die schwersten Queries der letzten Stunde.
Dieser Artikel enthält praxisfertige SQL-Abfragen für die häufigsten Monitoring-Szenarien. Alle Queries laufen auf MySQL 8 und sind direkt in Alerting-Systeme integrierbar oder manuell für Diagnose-Sessions nutzbar.
1. Buffer Pool Hit Ratio
Der InnoDB Buffer Pool ist der wichtigste Performance-Faktor in MySQL. Er hält häufig genutzte Datenseiten im RAM, sodass kostspielige Festplattenzugriffe vermieden werden. Die Buffer Pool Hit Ratio zeigt, wie oft MySQL Daten direkt aus dem RAM liefern konnte — der Zielwert liegt über 99%.
-- Buffer Pool Hit Ratio: target > 99%
-- Formula: (1 - physical_reads / logical_reads) * 100
SELECT
    FORMAT(Innodb_buffer_pool_read_requests, 0)              AS logical_reads,
    FORMAT(Innodb_buffer_pool_reads, 0)                      AS physical_reads,
    ROUND(
        (1 - Innodb_buffer_pool_reads / Innodb_buffer_pool_read_requests) * 100,
        4
    )                                                         AS hit_ratio_pct
FROM (
    SELECT
        (SELECT VARIABLE_VALUE FROM performance_schema.global_status
         WHERE VARIABLE_NAME = 'Innodb_buffer_pool_read_requests') AS Innodb_buffer_pool_read_requests,
        (SELECT VARIABLE_VALUE FROM performance_schema.global_status
         WHERE VARIABLE_NAME = 'Innodb_buffer_pool_reads')         AS Innodb_buffer_pool_reads
) AS stats;

-- Alternative: quick SHOW STATUS approach
SELECT
    VARIABLE_NAME,
    FORMAT(VARIABLE_VALUE, 0) AS value
FROM performance_schema.global_status
WHERE VARIABLE_NAME IN (
    'Innodb_buffer_pool_reads',
    'Innodb_buffer_pool_read_requests',
    'Innodb_buffer_pool_pages_total',
    'Innodb_buffer_pool_pages_free',
    'Innodb_buffer_pool_pages_dirty'
);

-- Buffer pool size vs. database size comparison
SELECT
    ROUND(@@innodb_buffer_pool_size / 1024 / 1024 / 1024, 2) AS buffer_pool_gb,
    ROUND(SUM(data_length + index_length) / 1024 / 1024 / 1024, 2) AS total_db_gb,
    ROUND(
        @@innodb_buffer_pool_size / SUM(data_length + index_length) * 100, 1
    )                                                          AS pool_coverage_pct
FROM information_schema.TABLES
WHERE engine = 'InnoDB';
Fällt die Hit Ratio unter 99%, sollte zunächst innodb_buffer_pool_size erhöht werden — auf dedizierten Datenbankservern auf 60-70% des verfügbaren RAM. Unter 95% ist die Datenbank definitiv I/O-bound und wird merklich langsamer reagieren.
2. Threads_running überwachen
Threads_running zeigt die Anzahl der Threads, die gerade aktiv eine Abfrage ausführen — im Gegensatz zu Threads_connected, das auch wartende Verbindungen zählt. Sporadische Spitzen sind normal; dauerhaft hohe Werte über 20 aktive Threads deuten auf Überlastung oder blockierende Long-Queries hin.
-- Current active threads and connection stats
SELECT
    (SELECT VARIABLE_VALUE FROM performance_schema.global_status
     WHERE VARIABLE_NAME = 'Threads_running')    AS threads_running,
    (SELECT VARIABLE_VALUE FROM performance_schema.global_status
     WHERE VARIABLE_NAME = 'Threads_connected')  AS threads_connected,
    (SELECT VARIABLE_VALUE FROM performance_schema.global_status
     WHERE VARIABLE_NAME = 'Threads_created')    AS threads_created,
    @@max_connections                             AS max_connections;

-- Live process list with running queries
SELECT
    id,
    user,
    host,
    db,
    command,
    time               AS seconds_running,
    state,
    LEFT(info, 200)    AS query_snippet
FROM information_schema.processlist
WHERE command != 'Sleep'
    AND time > 5
ORDER BY time DESC;

-- Connection usage percentage
SELECT
    ROUND(
        (SELECT VARIABLE_VALUE FROM performance_schema.global_status
         WHERE VARIABLE_NAME = 'Threads_connected')
        / @@max_connections * 100, 1
    ) AS connection_usage_pct;
3. Slow Queries pro Minute als Trendmetrik
Die Status-Variable Slow_queries akkumuliert die Anzahl aller Abfragen, die länger als long_query_time liefen, seit dem letzten Server-Start. Durch Differenzbildung über Zeitintervalle lässt sich ein Trend ableiten — besonders nützlich in Monitoring-Systemen wie Prometheus oder Zabbix.
-- Current slow query count (cumulative since server start)
SELECT
    VARIABLE_VALUE AS slow_queries_total
FROM performance_schema.global_status
WHERE VARIABLE_NAME = 'Slow_queries';

-- Calculate slow queries per minute manually:
-- Run twice, 60 seconds apart:
-- slow_per_minute = (second_value - first_value)

-- Complete query performance overview
SELECT
    (SELECT VARIABLE_VALUE FROM performance_schema.global_status
     WHERE VARIABLE_NAME = 'Slow_queries')       AS slow_queries,
    (SELECT VARIABLE_VALUE FROM performance_schema.global_status
     WHERE VARIABLE_NAME = 'Com_select')          AS total_selects,
    (SELECT VARIABLE_VALUE FROM performance_schema.global_status
     WHERE VARIABLE_NAME = 'Com_insert')          AS total_inserts,
    (SELECT VARIABLE_VALUE FROM performance_schema.global_status
     WHERE VARIABLE_NAME = 'Com_update')          AS total_updates,
    (SELECT VARIABLE_VALUE FROM performance_schema.global_status
     WHERE VARIABLE_NAME = 'Com_delete')          AS total_deletes,
    (SELECT VARIABLE_VALUE FROM performance_schema.global_status
     WHERE VARIABLE_NAME = 'Uptime')              AS uptime_seconds,
    ROUND(
        (SELECT VARIABLE_VALUE FROM performance_schema.global_status
         WHERE VARIABLE_NAME = 'Slow_queries')
        / (SELECT VARIABLE_VALUE FROM performance_schema.global_status
           WHERE VARIABLE_NAME = 'Uptime')
        , 4
    )                                              AS slow_queries_per_second;
4. Tabellengrößen ermitteln
Das Wachstum einzelner Tabellen ist ein häufig übersehener Performance-Faktor. Sehr große Tabellen ohne Archivierungsstrategie führen langfristig zu langsamen Abfragen und steigendem Speicherbedarf. information_schema.TABLES liefert Daten- und Indexgrößen pro Tabelle.
-- Top 20 largest tables in a specific database
SELECT
    table_name,
    table_rows,
    ROUND(data_length / 1024 / 1024, 2)          AS data_mb,
    ROUND(index_length / 1024 / 1024, 2)         AS index_mb,
    ROUND((data_length + index_length) / 1024 / 1024, 2) AS total_mb,
    ROUND(index_length / NULLIF(data_length, 0) * 100, 1) AS index_ratio_pct
FROM information_schema.TABLES
WHERE table_schema = DATABASE()
ORDER BY (data_length + index_length) DESC
LIMIT 20;

-- Database size summary across all schemas
SELECT
    table_schema                                                AS database_name,
    COUNT(*)                                                    AS table_count,
    ROUND(SUM(data_length) / 1024 / 1024 / 1024, 3)           AS data_gb,
    ROUND(SUM(index_length) / 1024 / 1024 / 1024, 3)          AS index_gb,
    ROUND(SUM(data_length + index_length) / 1024 / 1024 / 1024, 3) AS total_gb
FROM information_schema.TABLES
GROUP BY table_schema
ORDER BY SUM(data_length + index_length) DESC;

-- Tables with high index overhead (index larger than data)
SELECT
    table_schema,
    table_name,
    ROUND(data_length / 1024 / 1024, 1)  AS data_mb,
    ROUND(index_length / 1024 / 1024, 1) AS index_mb,
    ROUND(index_length / NULLIF(data_length, 0), 2) AS index_data_ratio
FROM information_schema.TABLES
WHERE table_schema NOT IN ('information_schema', 'performance_schema', 'mysql', 'sys')
    AND data_length > 0
ORDER BY index_length / NULLIF(data_length, 0) DESC
LIMIT 20;
5. Top Queries per Performance Schema
Das Performance Schema sammelt aggregierte Statistiken über alle ausgeführten Abfragen. Die Tabelle events_statements_summary_by_digest ist das zentrale Werkzeug für MySQL Monitoring SQL im Bereich Query-Performance: Sie liefert ohne zusätzliche Konfiguration die teuersten Abfragemuster der Instanz.
-- Top 10 queries by total execution time
SELECT
    ROUND(SUM_TIMER_WAIT / 1e12, 2)        AS total_sec,
    ROUND(AVG_TIMER_WAIT / 1e12, 4)        AS avg_sec,
    ROUND(MAX_TIMER_WAIT / 1e12, 4)        AS max_sec,
    COUNT_STAR                              AS executions,
    ROUND(SUM_ROWS_EXAMINED / COUNT_STAR)  AS avg_rows_examined,
    ROUND(SUM_ROWS_SENT / COUNT_STAR)      AS avg_rows_sent,
    SUM_CREATED_TMP_DISK_TABLES            AS tmp_disk_tables,
    SUM_NO_INDEX_USED                      AS no_index_used,
    LEFT(DIGEST_TEXT, 150)                 AS query
FROM performance_schema.events_statements_summary_by_digest
WHERE DIGEST_TEXT IS NOT NULL
ORDER BY SUM_TIMER_WAIT DESC
LIMIT 10;

-- Queries that never use an index (full table scans)
SELECT
    COUNT_STAR                      AS executions,
    ROUND(AVG_TIMER_WAIT / 1e12, 4) AS avg_sec,
    LEFT(DIGEST_TEXT, 200)          AS query
FROM performance_schema.events_statements_summary_by_digest
WHERE SUM_NO_INDEX_USED = COUNT_STAR
    AND COUNT_STAR > 10
ORDER BY COUNT_STAR DESC
LIMIT 20;

-- Queries with highest rows_examined to rows_sent ratio
SELECT
    LEFT(DIGEST_TEXT, 100)                                          AS query,
    COUNT_STAR,
    ROUND(SUM_ROWS_EXAMINED / NULLIF(SUM_ROWS_SENT, 0), 0)         AS examined_sent_ratio,
    ROUND(SUM_TIMER_WAIT / 1e12, 2)                                 AS total_sec
FROM performance_schema.events_statements_summary_by_digest
WHERE SUM_ROWS_SENT > 0
ORDER BY SUM_ROWS_EXAMINED / NULLIF(SUM_ROWS_SENT, 0) DESC
LIMIT 10;
6. Long-Running Transactions erkennen und beenden
Offene Transaktionen, die nicht committed oder zurückgerollt werden, sind eine häufige Ursache für Lock-Wartezeiten und wachsende Undo-Logs. Die Tabelle information_schema.innodb_trx gibt Auskunft über alle aktiven InnoDB-Transaktionen inklusive Startzeit, betroffener Tabellen und zugehörigem Thread.
-- Find transactions running longer than 60 seconds
SELECT
    trx_id,
    trx_state,
    trx_started,
    TIMESTAMPDIFF(SECOND, trx_started, NOW()) AS duration_seconds,
    trx_mysql_thread_id                        AS thread_id,
    trx_tables_in_use,
    trx_tables_locked,
    trx_rows_locked,
    trx_rows_modified,
    LEFT(trx_query, 200)                       AS current_query
FROM information_schema.innodb_trx
WHERE trx_started < NOW() - INTERVAL 60 SECOND
ORDER BY trx_started ASC;

-- Join with processlist to see the full context
SELECT
    t.trx_id,
    t.trx_state,
    TIMESTAMPDIFF(SECOND, t.trx_started, NOW()) AS duration_sec,
    p.user,
    p.host,
    p.db,
    p.command,
    LEFT(p.info, 300) AS query
FROM information_schema.innodb_trx t
JOIN information_schema.processlist p ON p.id = t.trx_mysql_thread_id
WHERE t.trx_started < NOW() - INTERVAL 30 SECOND
ORDER BY t.trx_started ASC;

-- Kill a long-running transaction (use thread_id from above)
-- KILL 4821;

-- Monitor lock wait queue
SELECT
    r.trx_id                                     AS waiting_trx_id,
    r.trx_mysql_thread_id                        AS waiting_thread,
    LEFT(r.trx_query, 100)                       AS waiting_query,
    b.trx_id                                     AS blocking_trx_id,
    b.trx_mysql_thread_id                        AS blocking_thread,
    LEFT(b.trx_query, 100)                       AS blocking_query
FROM information_schema.innodb_lock_waits w
JOIN information_schema.innodb_trx r ON r.trx_id = w.requesting_trx_id
JOIN information_schema.innodb_trx b ON b.trx_id = w.blocking_trx_id;
7. Replikations-Lag messen
Bei MySQL-Replikation (Primary/Replica-Setup) ist der Replikations-Lag — Seconds_Behind_Source in MySQL 8-Terminologie — eine kritische Metrik. Ein wachsender Lag bedeutet, dass der Replica den Primary nicht mehr einholen kann, was Leseanfragen auf dem Replica veraltete Daten liefert.
-- Check replication status on replica (MySQL 8 naming)
SHOW REPLICA STATUS\G

-- Key fields to monitor:
-- Replica_IO_Running:     YES = IO thread running
-- Replica_SQL_Running:    YES = SQL thread running
-- Seconds_Behind_Source:  0 = no lag, NULL = not connected, >0 = lag in seconds
-- Last_Error:             should be empty string

-- Programmatic replication lag check
SELECT
    SERVICE_STATE     AS io_thread_state,
    CHANNEL_NAME
FROM performance_schema.replication_connection_status;

SELECT
    SERVICE_STATE     AS sql_thread_state,
    LAST_ERROR_MESSAGE,
    CHANNEL_NAME
FROM performance_schema.replication_applier_status;

-- Replica lag in seconds (returns NULL if not a replica)
SELECT
    VARIABLE_VALUE    AS seconds_behind_source
FROM performance_schema.global_status
WHERE VARIABLE_NAME = 'Seconds_Behind_Master';

-- On PRIMARY: check connected replicas
SHOW REPLICAS;

-- Monitor binary log position on primary
SHOW MASTER STATUS;
SELECT @@log_bin, @@binlog_format, @@binlog_row_image;
8. Festplattenplatz für MySQL ermitteln
Wachsende Datenbanken ohne Speicher-Monitoring führen zu unkontrollierten Ausfällen, wenn die Festplatte voll läuft. Die folgenden Abfragen liefern einen vollständigen Überblick über den Speicherbedarf auf Datenbank-, Tabellen- und Engine-Ebene.
-- Total disk usage across all databases (in GB)
SELECT
    table_schema                                                      AS database_name,
    COUNT(*)                                                          AS tables,
    ROUND(SUM(data_length + index_length) / 1024 / 1024 / 1024, 3)  AS total_gb,
    ROUND(SUM(data_free) / 1024 / 1024 / 1024, 3)                   AS fragmented_gb
FROM information_schema.TABLES
WHERE table_schema NOT IN ('information_schema', 'performance_schema', 'sys')
GROUP BY table_schema
ORDER BY SUM(data_length + index_length) DESC;

-- Tables with most fragmentation (candidates for OPTIMIZE TABLE)
SELECT
    table_schema,
    table_name,
    ROUND(data_length / 1024 / 1024, 1)  AS data_mb,
    ROUND(data_free / 1024 / 1024, 1)    AS fragmented_mb,
    ROUND(data_free / NULLIF(data_length, 0) * 100, 1) AS fragmentation_pct
FROM information_schema.TABLES
WHERE data_free > 104857600  -- more than 100 MB fragmented
    AND table_schema NOT IN ('information_schema', 'performance_schema', 'sys')
ORDER BY data_free DESC
LIMIT 20;

-- InnoDB log file and temp file usage
SELECT
    @@innodb_log_file_size          AS redo_log_size_bytes,
    @@innodb_log_files_in_group     AS redo_log_files,
    ROUND(@@innodb_log_file_size * @@innodb_log_files_in_group / 1024 / 1024, 0) AS total_redo_mb,
    @@tmp_table_size                AS tmp_table_size,
    @@max_heap_table_size           AS max_heap_table_size;
Mironsoft
MySQL Monitoring & Datenbankdiagnose
MySQL-Monitoring professionell aufsetzen?
Wir implementieren ein vollständiges MySQL-Monitoring für Ihren Shop oder Ihre Anwendung — mit sinnvollen Alerting-Schwellenwerten, Dashboards und proaktiver Optimierung.
Health-Check-Setup
Buffer Pool, Thread-Überwachung, Transaction-Monitoring
Alerting
Sinnvolle Schwellenwerte, Grafana/Prometheus-Integration
Replikation
Lag-Monitoring, Failover-Konzepte, Read-Replica-Setup
9. Zusammenfassung
Effektives MySQL Monitoring SQL erfordert keine externen Tools — alle wichtigen Metriken sind direkt über SQL abfragbar. Die Buffer Pool Hit Ratio zeigt, ob der RAM-Cache ausreicht. Threads_running über 20 ist ein Frühwarnsignal. Long-Running Transactions über information_schema.innodb_trx aufzuspüren verhindert Lock-Eskalationen. Das Performance Schema liefert die teuersten Queries ohne Slow Query Log.
MySQL Monitoring SQL – Das Wichtigste auf einen Blick
Buffer Pool Hit Ratio
(1 - reads/read_requests) * 100. Ziel: >99%. Unter 95%: innodb_buffer_pool_size erhöhen auf 60-70% des Server-RAM.
Threads_running Alert
Sporadische Spitzen sind normal. Dauerhaft >20: Überlastungssignal. SHOW PROCESSLIST für Details zu laufenden Abfragen.
Long-Running Transactions
information_schema.innodb_trx WHERE trx_started < NOW() - INTERVAL 60 SECOND. Offene Transaktionen halten Locks und lassen das Undo-Log wachsen.
Replikations-Lag
SHOW REPLICA STATUS: Seconds_Behind_Source sollte 0 sein. NULL = Replikation nicht verbunden. Alert ab >30 Sekunden empfohlen.
10. FAQ: MySQL Monitoring SQL
1Was ist die Buffer Pool Hit Ratio und wie berechnet man sie?
(1 - reads / read_requests) * 100. Zielwert: über 99%. Unter 95% sollte innodb_buffer_pool_size erhöht werden.2Was ist Threads_running und wann ist es kritisch?
3Wie findet man Long-Running Transactions in MySQL?
SELECT * FROM information_schema.innodb_trx WHERE trx_started < NOW() - INTERVAL 60 SECOND zeigt alle Transaktionen über 60 Sekunden. Sie halten Locks und lassen das Undo-Log wachsen.4Wie überprüft man den Replikations-Lag?
SHOW REPLICA STATUS gibt Seconds_Behind_Source zurück. Wert 0 = kein Lag. NULL = Replikation nicht verbunden. Alert empfohlen ab >30 Sekunden Lag.5Wie ermittelt man die größten Tabellen in MySQL?
information_schema.TABLES: SELECT table_name, ROUND((data_length + index_length)/1024/1024, 2) AS mb FROM information_schema.TABLES WHERE table_schema = 'db' ORDER BY (data_length + index_length) DESC LIMIT 20.6Wie findet man die teuersten Queries im Performance Schema?
performance_schema.events_statements_summary_by_digest nach ORDER BY sum_timer_wait DESC LIMIT 10 liefert die Top-Queries nach Gesamtausführungszeit.7Was ist Slow_queries in SHOW STATUS?
8Wie berechnet man den gesamten Festplattenplatz für MySQL?
SELECT table_schema, ROUND(SUM(data_length + index_length)/1024/1024/1024, 3) AS gb FROM information_schema.TABLES GROUP BY table_schema ORDER BY gb DESC liefert den Speicherbedarf pro Datenbank.9Was sind sinnvolle Alert-Schwellenwerte für MySQL?
10Welche MySQL Status-Variablen sind am wichtigsten?
Innodb_buffer_pool_reads, Innodb_buffer_pool_read_requests, Threads_running, Slow_queries, Innodb_row_lock_waits, Com_select/insert/update/delete.